공공서비스의 효율성 평가: 한국 정부 3.0 사례를 중심으로Assessment of efficiency in public service–focused on Government 3.0 case in Korea
원문 제목: Assessment of efficiency in public service–focused on Government 3.0 case in Korea
번역 제목은 이 사이트의 편집 번역입니다. 서지와 인용에는 원문 제목을 사용합니다.Translated titles are editorial translations for this site. Bibliographic records and citations retain the original title.
저자 표시: Author notes: 굵은 글씨: 김용희Bold: Yonghee Kim 교신저자Corresponding author
Total Quality Management & Business Excellence, 29(9-10), 1161–1184색인: Indexed in: SSCI
요약Summary
한국 중앙행정기관 42곳의 정부3.0 효율성을 부트스트랩 DEA와 2단계 회귀분석으로 평가했다. 시민 중심 서비스 통합, 시스템 구축 투자, 별도 IT 통합센터가 효율성 차이와 연결되는 요인으로 나타났다.
Bootstrapped DEA and second-stage regression assess Government 3.0 efficiency in 42 Korean central administrative agencies. Citizen-centered service integration, investment in system construction, and a separate IT integration center are associated with efficiency differences.
한눈에 보기At a glance
- 표본 크기Sample size
- N = 42
- 방법Methods
- Bootstrapped Data Envelopment Analysis
- Second-Stage Regression
- 키워드Keywords
- E-government
- Government 3.0
- DEA
- Public Service Efficiency
- Digital Government
- Administrative Agencies
- Tobit Regression
원문을 바탕으로 연구의 논리와 결과를 풀어쓴 해설입니다. 수치는 표시한 표와 쪽을 기준으로 읽습니다. 아래 표는 핵심 항목을 웹에서 읽도록 재구성했고, 원문 표·그림이 있는 페이지를 함께 제공합니다.This reading guide explains the paper’s reasoning and findings in new wording. Tables below re-present selected source results for web reading, alongside images of the relevant original pages.
전자정부 성과를 투입 대비 산출로 비교하면Comparing e-government outputs relative to inputs
공공데이터와 온라인 서비스를 많이 제공하는 기관이 항상 효율적인 기관일까요? 이 연구는 한국 정부3.0 추진에서 기관이 사용한 IT 예산·인력과 만들어낸 정책·데이터·온라인 서비스를 함께 놓고 상대 효율성을 평가합니다. 이어 효율성 차이가 어떤 투자와 서비스 통합 특성과 연결되는지 살핍니다.
An agency producing many datasets or online services is not necessarily efficient relative to its resources. This paper assesses Korean Government 3.0 using both inputs and outputs, then examines which investment and service-integration characteristics are associated with differences in relative agency efficiency.
PDF 파일 2, 6, 9쪽PDF pages 2, 6, 9
중앙행정기관 42곳의 투입과 공공서비스 산출Inputs and service outputs of 42 central agencies
분석 대상은 중앙행정기관 42곳입니다. DEA 투입에는 IT 예산과 직원 수, 산출에는 정부3.0 정책 수·개방 공공데이터·온라인 신청 가능 서비스가 포함됩니다. IT 예산 자료는 2014~2016년 범위를 사용하며 정책·서비스 자료는 정부 웹사이트와 실적 문서 등에서 모았습니다.
The units are 42 central administrative agencies. DEA inputs are IT budget and staff; outputs include Government 3.0 policies, open data and services available for online application. Budget sources cover 2014–2016, while policy and service outputs are assembled from government websites and performance documents.
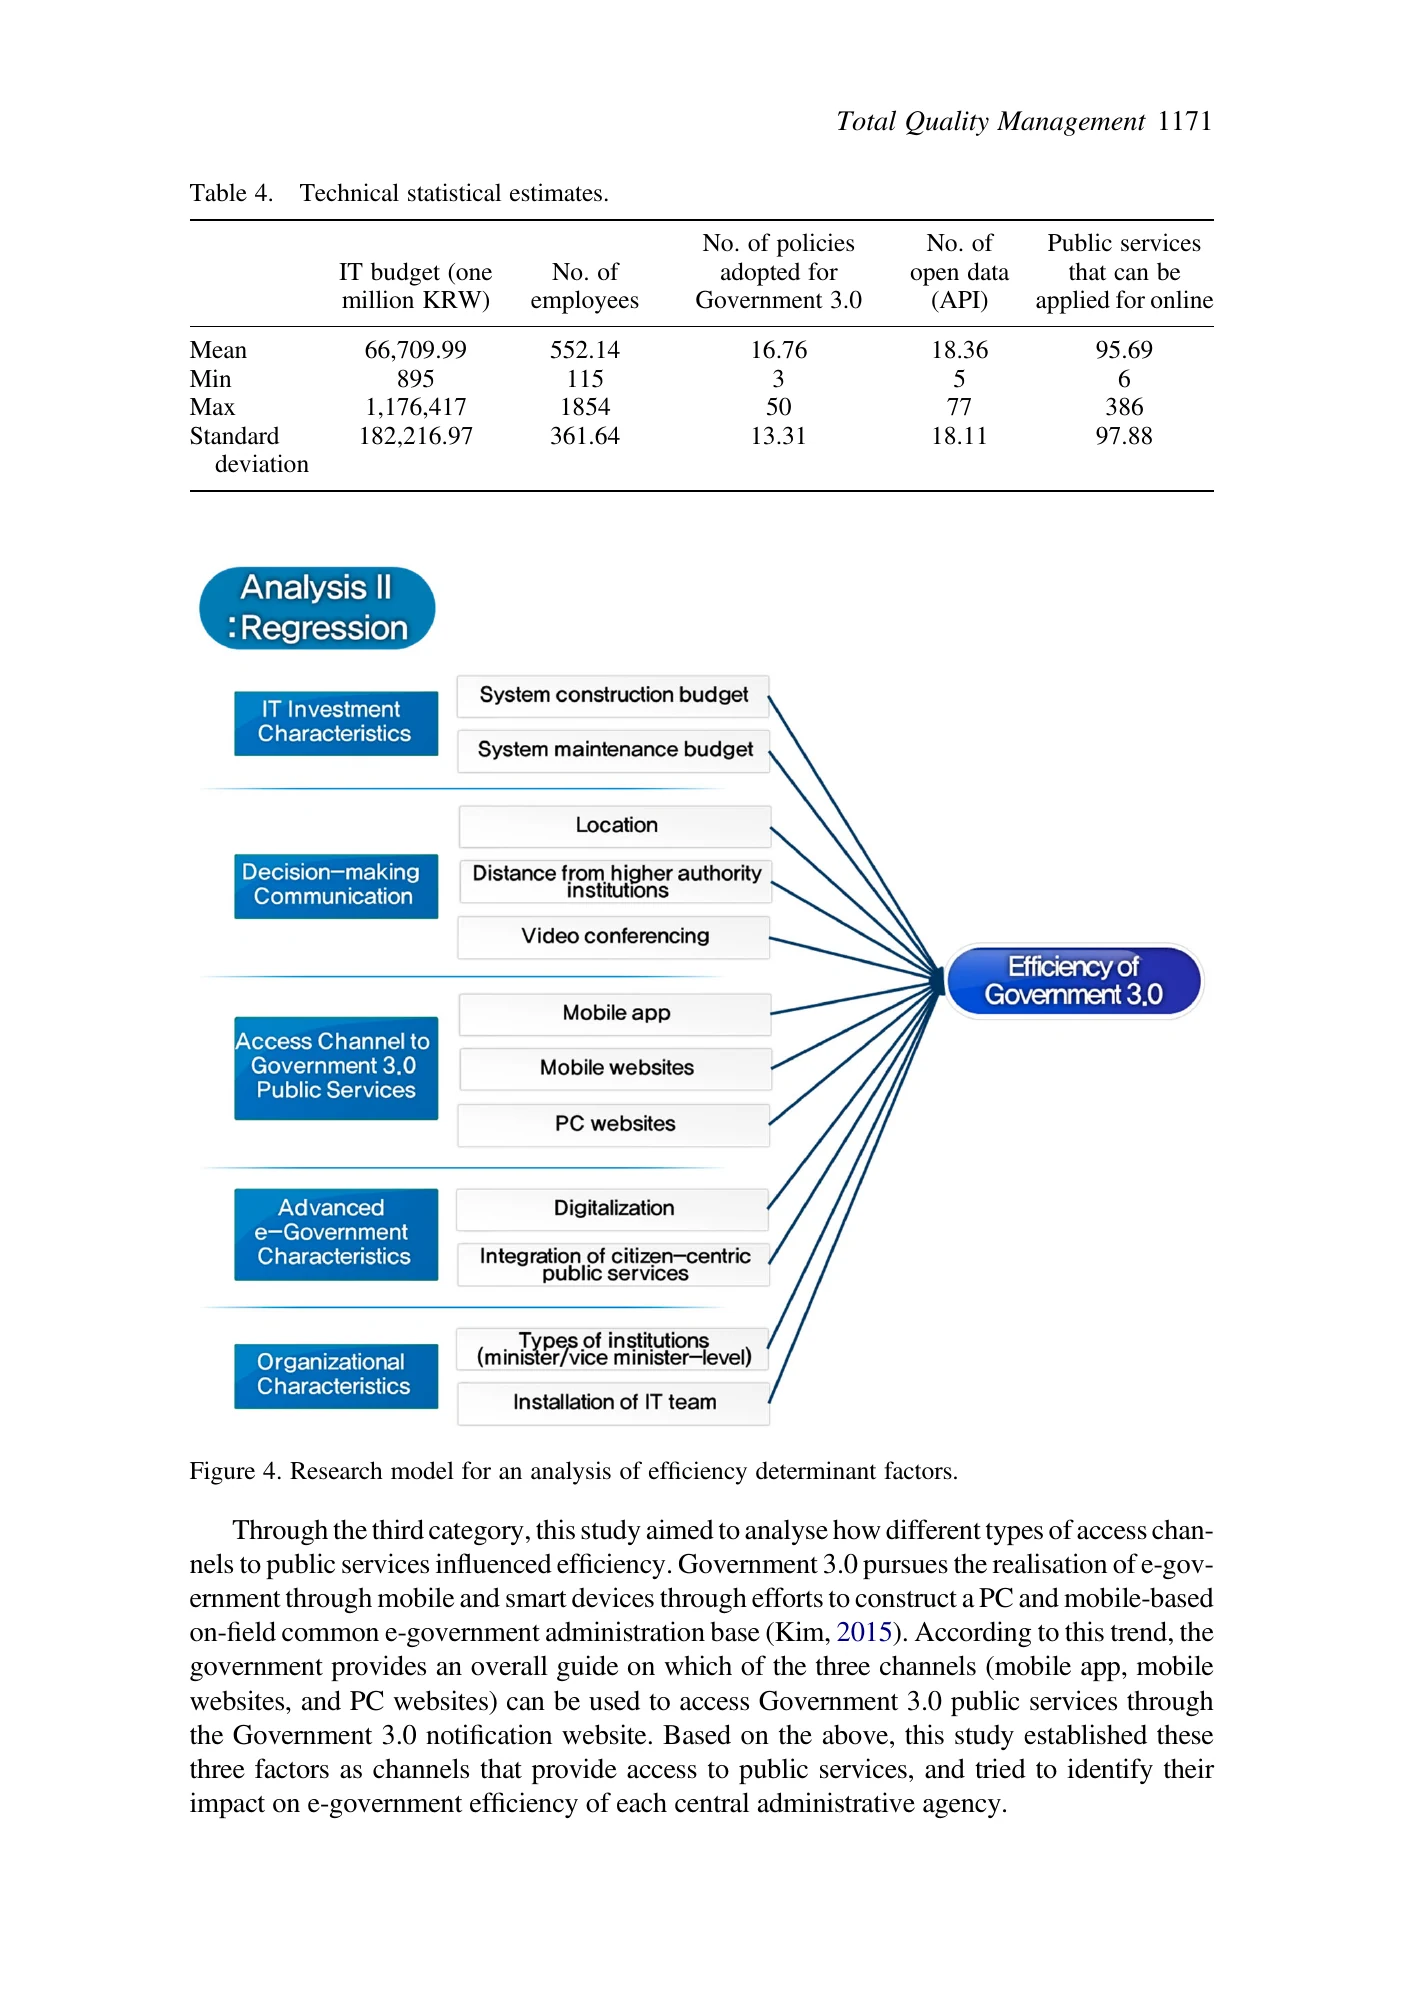
2단계 분석은 구축·유지 예산, 입지와 의사소통, 접근 채널, 디지털화, 시민 중심 서비스 통합, 조직 특성을 설명변수로 사용합니다. 서비스의 개수와 제공 방식은 측정하지만 시민의 삶이 얼마나 개선됐는지를 직접 측정한 영향평가 자료는 아닙니다.
Second-stage predictors cover construction and maintenance spending, location and communication, access channels, digitalization, citizen-centered integration and organizational features. Counts and delivery arrangements measure outputs; they do not directly measure how much citizens’ welfare or service outcomes improved.
PDF 파일 10, 11, 12, 14쪽PDF pages 10, 11, 12, 14
부트스트랩 DEA 뒤에 회귀분석을 연결Bootstrap DEA followed by regression
DEA는 예산과 인력에 비해 정책·서비스 산출이 앞선 기관을 기준으로 상대적인 경계를 만듭니다. 부트스트랩은 표본 경계에서 생길 수 있는 편의와 불확실성을 점검합니다. 규모수익 일정인 CCR과 규모수익 가변인 BCC를 나누면 규모 요소를 포함한 효율성과 순수 기술 효율성을 비교할 수 있습니다.
DEA constructs a relative frontier linking resources to outputs. Bootstrapping addresses sampling bias and uncertainty around the estimated boundary. CCR assumes constant returns to scale, while BCC permits variable returns, helping distinguish efficiency incorporating scale from pure technical efficiency.
이 효율성 점수를 다시 OLS와 Tobit 회귀의 종속변수로 사용합니다. 둘째 단계의 계수는 투입·서비스 특성과 추정 효율성의 관계이며, IT 예산을 늘리는 실험이나 통합 서비스 도입의 무작위 평가를 수행한 것은 아닙니다. 모형 가정에 따른 결과 차이를 함께 읽어야 합니다.
OLS and Tobit regressions then use estimated efficiency scores as outcomes. Their coefficients relate institutional characteristics to a constructed relative-efficiency measure. They are not experimental estimates of increasing a budget or introducing integrated services, and results should be compared across the returns-to-scale specifications.
PDF 파일 7, 9, 10, 13, 14쪽PDF pages 7, 9, 10, 13, 14
시민 중심 통합은 두 모형에서 양의 관계Citizen-centered integration is positive in both models
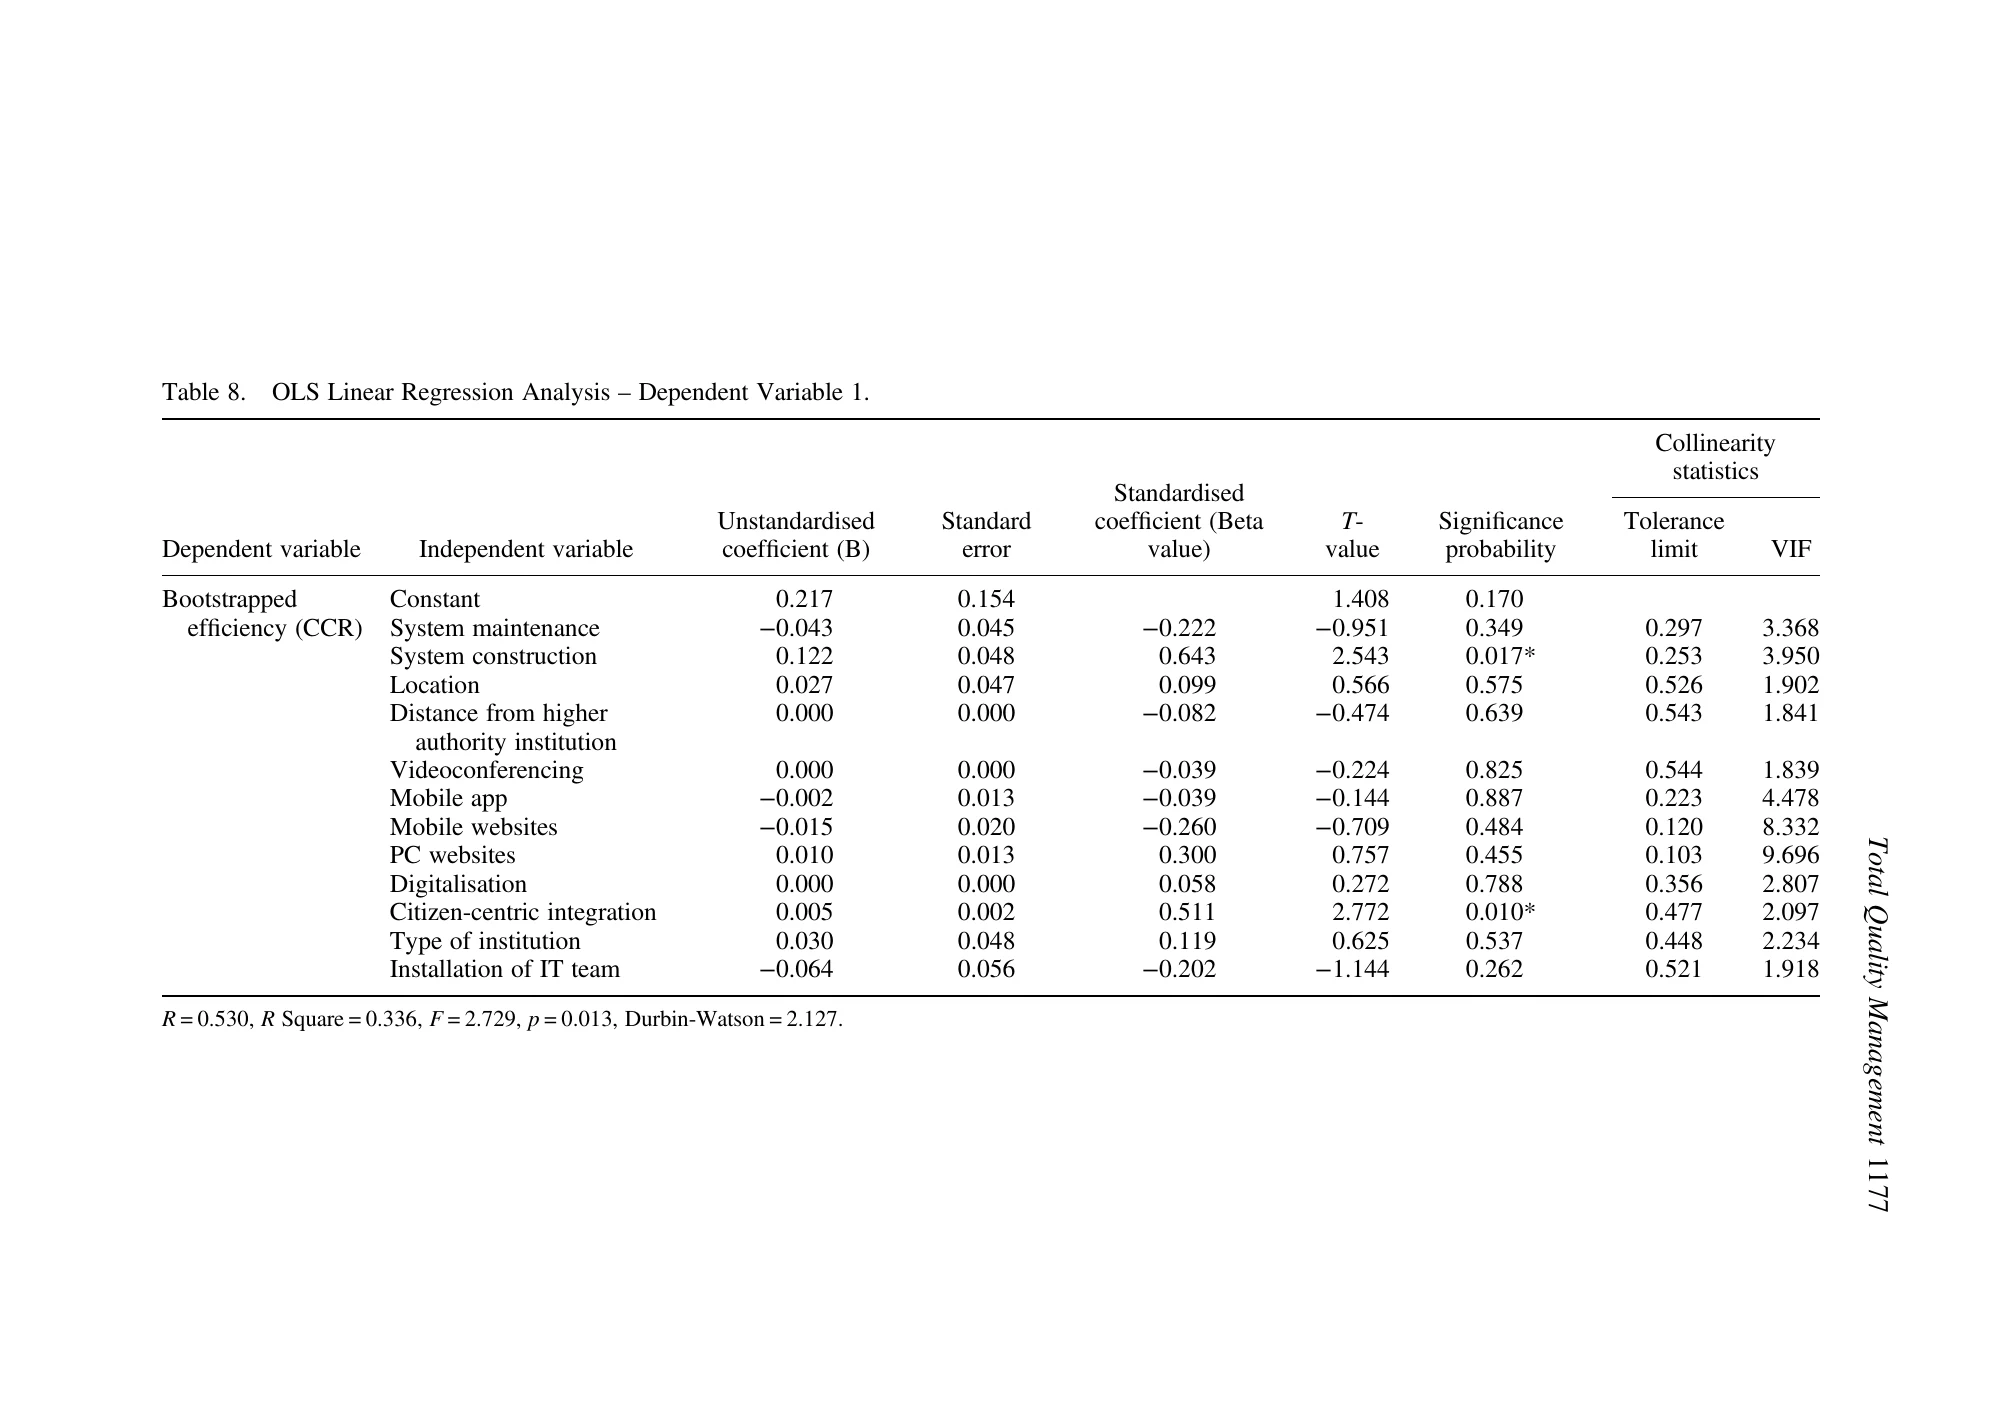
OLS의 CCR 효율성에서는 시스템 구축의 표준화 계수 0.643(p=0.017), 시민 중심 통합 0.511(p=0.010)이 유의합니다. BCC에서는 통합이 0.586(p=0.005)로 유의하지만 구축 예산 0.427(p=0.120)은 유의하지 않습니다. 따라서 두 요인을 같은 종류의 효율성 개선으로 묶지 않습니다.
In the CCR OLS model, standardized coefficients are 0.643 for system construction (p=0.017) and 0.511 for citizen-centered integration (p=0.010). In BCC, integration remains significant at 0.586 (p=0.005), while construction is insignificant at 0.427 (p=0.120). The two characteristics therefore relate differently to the efficiency definitions.
Tobit 결과도 시민 중심 통합의 양의 관계를 보고하며, 조직의 IT 운영체계도 분석에 포함됩니다. 다만 조직 더미의 부호는 코딩 기준에 따라 읽어야 하므로 'IT 팀을 없애면 효율이 오른다'와 같은 단순 처방으로 바꾸지 않습니다. 표준화 계수와 비표준화 계수의 크기도 직접 혼합하지 않습니다.
Tobit models likewise report a positive integration association and consider IT organizational arrangements. Organizational dummy signs require their coding reference, so they cannot be converted into a prescription such as removing an IT team. Standardized OLS coefficients and unstandardized coefficients also should not be mixed into one magnitude ranking.
PDF 파일 18, 19, 20쪽PDF pages 18, 19, 20
핵심 결과를 표로 읽기Read the key results in tables
| 설명변수Predictor | CCR β / p | BCC β / p |
|---|---|---|
| 시스템 구축System construction | 0.643 / 0.017 | 0.427 / 0.120 |
| 시민 중심 서비스 통합Citizen-centered integration | 0.511 / 0.010 | 0.586 / 0.005 |
원문 표 8·9의 표준화 OLS 계수. 비표준화 B 및 Tobit 계수와 혼합하지 않았습니다. 효율성 점수와의 관련성이며 인과효과가 아닙니다.Standardized OLS coefficients from Tables 8–9, not mixed with unstandardized B or Tobit estimates. These are associations with estimated efficiency scores.
원문 표 8·9 발췌Selected standardized estimates from original Tables 8–9 · PDF 파일 18, 19쪽PDF pages 18, 19
원문의 핵심 표·그래프Key tables & figures in the source
표·그림이 수록된 원문 페이지입니다. 이미지를 누르면 확대할 수 있습니다.Original pages containing the selected tables or figures. Select an image to enlarge it.
효율성 결정요인 분석 모형Model of efficiency determinants
CCR 효율성의 회귀 결과Regression for CCR efficiency
디지털화의 개수보다 통합된 이용 경험Look beyond counts toward integrated service delivery
전자정부 평가에 투입 대비 산출과 시민 중심 통합을 함께 넣을 필요가 있다는 시사점입니다. 기관별 시스템을 추가하는 것과 시민이 한 흐름으로 서비스를 이용하게 하는 것은 다른 전략일 수 있습니다. 저자는 시민·직원의 참여도 강조하지만 이 참여의 별도 효과 크기까지 추정한 것은 아닙니다.
The findings support evaluating resource use alongside citizen-centered integration. Adding separate agency systems may differ from enabling citizens to navigate one connected service journey. Citizen and employee participation are discussed as implementation considerations, but their separate causal contribution is not quantified by this analysis.
PDF 파일 21, 22, 23쪽PDF pages 21, 22, 23
산출의 효율성과 공공가치의 효과성은 다름Output efficiency differs from public-value effectiveness
42개 한국 기관의 상대 비교이므로 국가별 행정구조나 현재 전자정부에 자동 적용할 수 없습니다. 산출의 수량이 품질·형평성·접근성·실제 이용 성과를 모두 대표하지도 않습니다. DEA의 비교집단·변수 선택과 작은 표본의 2단계 회귀 한계를 유지하면서 결과를 진단용 근거로 읽는 것이 적절합니다.
The comparison concerns 42 Korean agencies and does not automatically generalize to other administrative systems or current digital government. Output counts cannot encompass quality, equity, accessibility and actual use. DEA specification, reference groups and a small second-stage sample limit causal and substantive interpretation.
PDF 파일 23쪽PDF page 23
근거 쪽: Evidence pages: 2, 6, 7, 9, 10, 11, 12, 13, 14, 18, 19, 20, 21, 22, 23 · PDF 파일 기준, 인쇄 쪽수와 다를 수 있습니다. · PDF file pagination may differ from printed page numbers. 원문 출처 ↗Source ↗
원문 이미지 보기 · 1장View original document images · 1
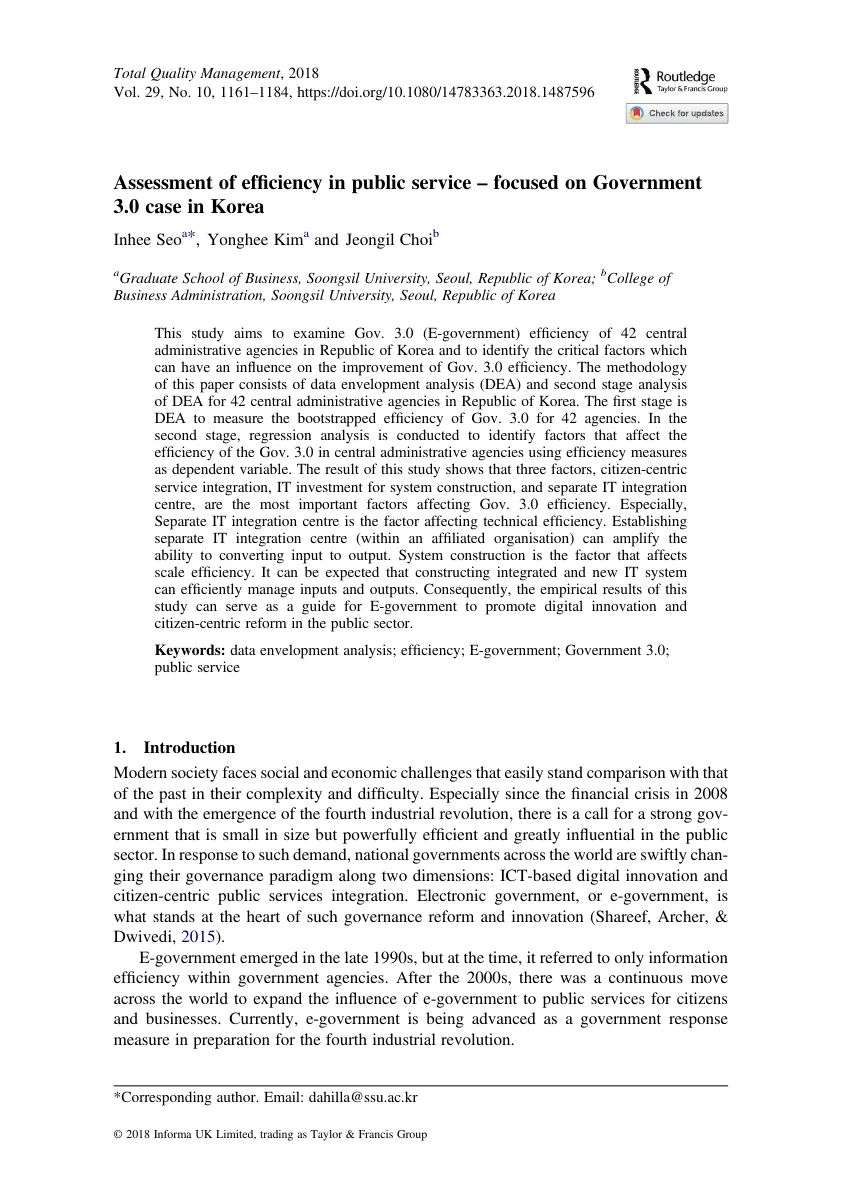
서지 정보Bibliographic information
- 학술지Journal
- Total Quality Management & Business Excellence
- 권(호)Volume (issue)
- 29(9-10)
- 쪽Pages
- 1161–1184
- 게재Published
- 2018
- 색인Indexing
-
- SSCI (저자 실적 기록 기준)(per the author's records)
- 인용Citations
- Google Scholar 인용 21Cited by 21 (Google Scholar) (새 창) (opens in a new tab) (2026-09-27 기준)(as of 2026-09-27)
인용하기Cite APA · BibTeX
APA
Seo, I., Kim, Y., & Choi, J. (2018). Assessment of efficiency in public service–focused on Government 3.0 case in Korea. Total Quality Management & Business Excellence, 29(9-10), 1161–1184. https://doi.org/10.1080/14783363.2018.1487596
BibTeX
@article{seo2018-efficiency,
  author = {Seo, Inhee and Kim, Yonghee and Choi, Jeongil},
  title = {Assessment of efficiency in public service–focused on Government 3.0 case in Korea},
  journal = {Total Quality Management \& Business Excellence},
  year = {2018},
  volume = {29},
  number = {9-10},
  pages = {1161--1184},
  doi = {10.1080/14783363.2018.1487596}
}