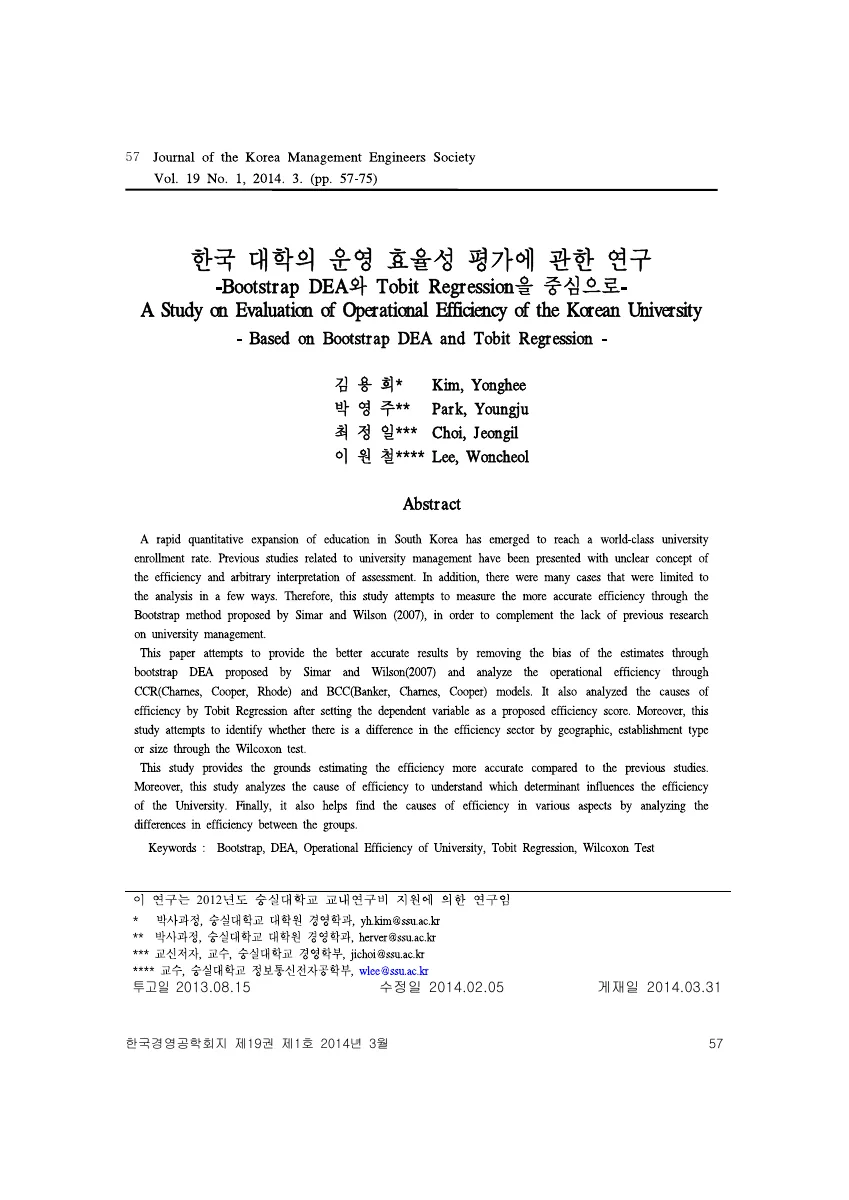
한국 대학의 운영 효율성 평가에 관한 연구: Bootstrap DEA와 Tobit Regression을 중심으로Operational Efficiency of Korean Universities: Bootstrap DEA and Tobit Regression
Original title: 한국 대학의 운영 효율성 평가에 관한 연구: Bootstrap DEA와 Tobit Regression을 중심으로
번역 제목은 이 사이트의 편집 번역입니다. 서지와 인용에는 원문 제목을 사용합니다.Translated titles are editorial translations for this site. Bibliographic records and citations retain the original title.
저자 표시: Author notes: 굵은 글씨: 김용희Bold: Yonghee Kim 교신저자Corresponding author
한국경영공학회지, 19(1), 57–75색인: Indexed in: KCI
요약Summary
한국 대학의 교육·연구·종합 운영 효율성을 부트스트랩 DEA와 Tobit 회귀로 분석했다. 연구성과 모형의 효율성이 상대적으로 낮았으며, 수도권 소재와 재정지원 수혜 등과의 관계는 모형과 규모 가정에 따라 달랐다.
Bootstrapped DEA and Tobit regression examine educational, research, and overall operational efficiency in Korean universities. Research efficiency is relatively lower, while associations with metropolitan location and financial support vary by model and returns-to-scale assumption.
한눈에 보기At a glance
- 방법Methods
- Bootstrapped DEA
- CCR and BCC Models
- Tobit Regression
- Wilcoxon Test
원문을 바탕으로 연구의 논리와 결과를 풀어쓴 해설입니다. 수치는 표시한 표와 쪽을 기준으로 읽습니다. 아래 표는 핵심 항목을 웹에서 읽도록 재구성했고, 원문 표·그림이 있는 페이지를 함께 제공합니다.This reading guide explains the paper’s reasoning and findings in new wording. Tables below re-present selected source results for web reading, alongside images of the relevant original pages.
연구 질문과 배경Question and context
대학은 교육과 연구를 함께 수행하지만 하나의 성과 순위로 묶으면 어떤 활동이 자원에 비해 충분한 성과를 내는지 보이지 않을 수 있다. 이 연구는 한국 대학을 종합·교육·연구 모형으로 나누어 운영 효율성을 비교하고, 설립형태·소재지·연구비와 재정지원이 효율성 점수와 어떤 관계를 갖는지 묻는다. 대학의 가치 전체를 순위화하기보다 선택된 투입과 산출의 조합에서 상대적 운영 차이를 파악하려는 연구다.
A university combines education and research, so a single performance ranking may conceal differences between activities. This study compares overall, educational and research efficiency and examines associations with foundation type, location, research funding and financial support. Its question concerns relative operations under selected input–output definitions, rather than a comprehensive ranking of educational quality, academic worth or social contribution.
PDF 파일 8, 9, 15, 16쪽PDF pages 8, 9, 15, 16
자료와 변수Data and variables
대학정보공시의 2012년 자료를 사용했다. 투입은 교원·직원 1인당 학생 수, 교사확보율, 학생 1인당 도서구입비·교육비·장학금의 6개 지표이고, 산출은 국내외 논문·저역서와 취업률·학생유지율·신입생 경쟁률의 6개 지표다. 다만 표본 설명은 일반대학 156개라고 쓰는 반면 규모수익 표5는 합계154개다. 따라서 표본 수를 하나로 확정한 전수 통계로 소개하지 않고, 원문에 표본 규모 불일치가 남아 있음을 함께 표시한다.
The study uses 2012 university-disclosure data. Six inputs cover staffing ratios, building provision and per-student spending; outputs cover publications, books, employment, retention and admissions competition. The sample paragraph states 156 general universities, whereas Table 5 totals 154. The discrepancy is preserved here instead of presenting a single reconciled census count. The chosen variables also represent only particular dimensions of university activity.
PDF 파일 8, 9, 10, 13쪽PDF pages 8, 9, 10, 13
방법을 쉽게 읽기How the method works
DEA는 비슷한 대학끼리 비교해 주어진 자원으로 가능한 성과의 경계를 만든다. CRS는 규모에 비례한 산출 변화를 가정하고 VRS는 규모 효과를 더 유연하게 허용한다. 부트스트랩은 반복 표본으로 점수의 편의를 추정해 보정한다. 이어 Wilcoxon 검정으로 집단 간 차이를 보고 Tobit 회귀로 0~1 범위의 효율성 점수와 환경요인의 관계를 분석했다. 이는 선택한 비교집단과 지표에 의존하는 상대적 평가이며, 정책 지원의 무작위 효과를 측정한 것은 아니다.
DEA constructs a performance frontier from comparable universities. CRS imposes proportional scaling, while VRS allows a more flexible scale relationship. Bootstrapping estimates sampling bias; Wilcoxon tests compare groups, and Tobit models relate bounded scores to environmental variables. These are relative measurements conditional on the selected institutions and indicators. The regressions do not identify the causal effect of allocating a funding programme.
PDF 파일 8, 11, 14쪽PDF pages 8, 11, 14
주요 결과와 수치의 의미Findings and their meaning
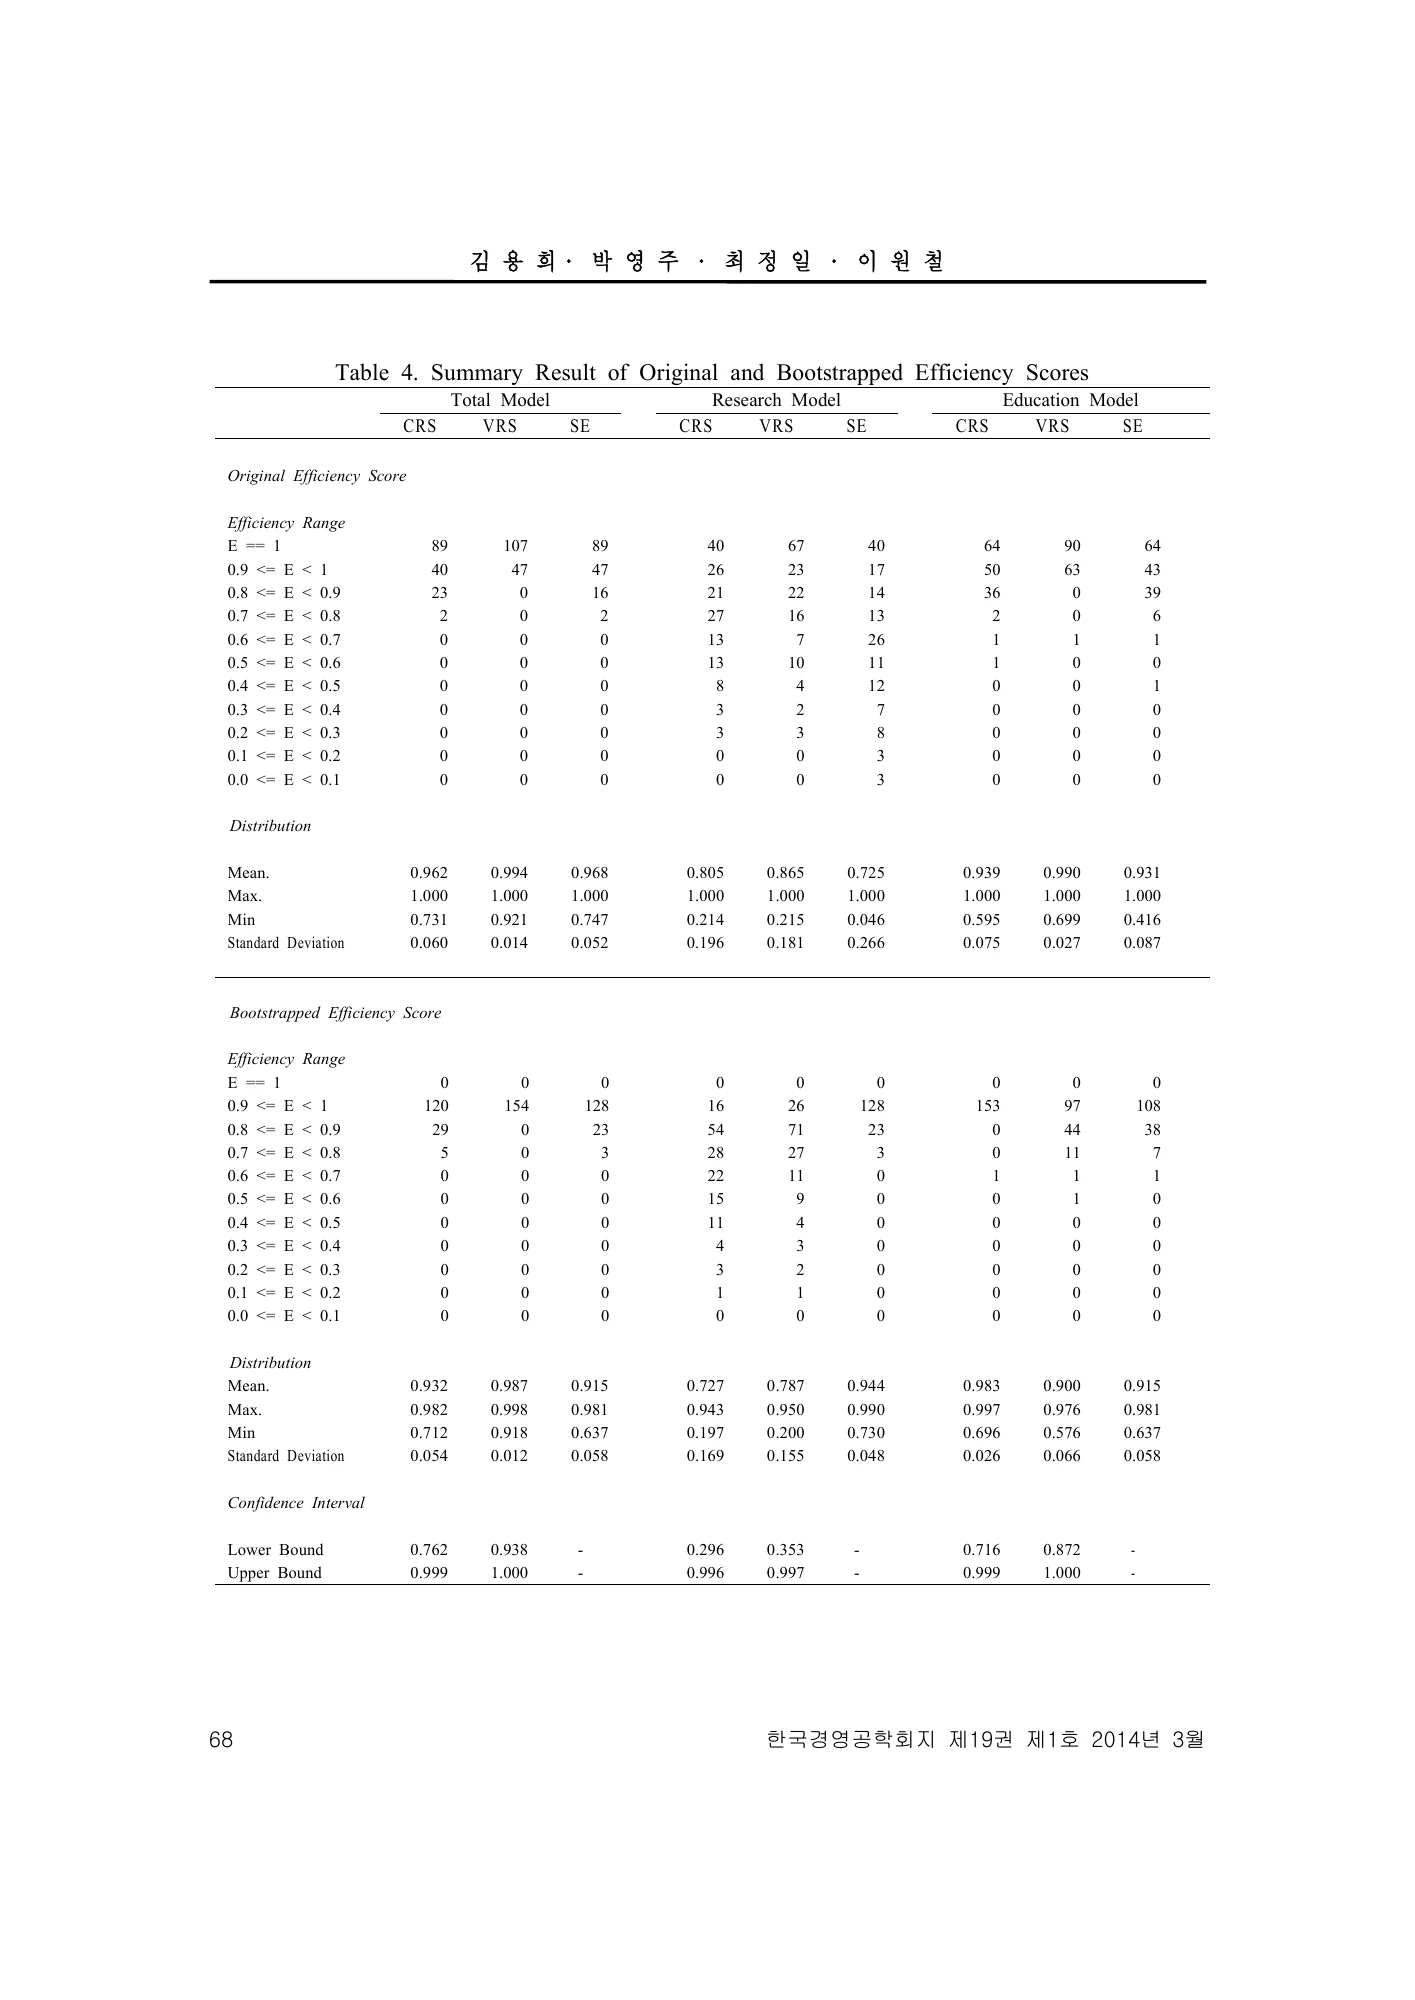
표4에서 종합모형의 평균 CRS는 일반 DEA 0.962에서 편의보정 후 0.932로, 연구모형 CRS는 0.805에서 0.727로 낮아진다. VRS도 종합모형 0.994→0.987, 연구모형 0.865→0.787로 보고된다. 연구모형의 상대적 효율성이 더 낮고 보정의 영향도 더 크다는 비교는 이 값들에서 확인된다. 회귀 결과는 모형과 규모 가정에 따라 다르다. 예컨대 교내 연구비는 연구모형 CRS에서 양의 관계를 보이지만 모든 연구모형과 교육모형에서 동일한 관계가 성립하는 것은 아니다.
Table 4 reports overall CRS efficiency falling from 0.962 to 0.932 after bias adjustment, and research CRS from 0.805 to 0.727. Reported VRS values change from 0.994 to 0.987 overall and from 0.865 to 0.787 for research. Research scores are therefore lower and more sensitive to adjustment in these comparisons. Regression associations vary by model and scale assumption; they should not be compressed into a universal funding rule.
PDF 파일 11, 12, 15쪽PDF pages 11, 12, 15
핵심 결과를 표로 읽기Read the key results in tables
| 모형Model | 규모 가정Scale assumption | 일반 DEAOriginal DEA | 부트스트랩 DEABootstrapped DEA |
|---|---|---|---|
| 종합Overall | CRS | 0.962 | 0.932 |
| 종합Overall | VRS | 0.994 | 0.987 |
| 연구Research | CRS | 0.805 | 0.727 |
| 연구Research | VRS | 0.865 | 0.787 |
표4에서 선별했다. 효율성은 선택 지표에 대한 상대적 점수이며 종합 대학 순위가 아니다. 일부 다른 열과 표본 수는 정합성 확인이 필요하다.Selected from Table 4. Scores are relative to chosen indicators; other columns and sample counts require reconciliation.
원문 Table 4, PDF12쪽Source Table 4, PDF p.12 · PDF 파일 12쪽PDF page 12
원문의 핵심 표·그래프Key tables & figures in the source
표·그림이 수록된 원문 페이지입니다. 이미지를 누르면 확대할 수 있습니다.Original pages containing the selected tables or figures. Select an image to enlarge it.
표4 일반·부트스트랩 효율성 비교Table 4: original and bootstrapped efficiency
시사점Implications
원문은 취업률 등 교육성과 중심의 평가가 연구의 장기적 특성을 충분히 반영하는지 재검토하고, 자율적 연구 주제·행정 간소화·후속세대 지원을 함께 고려하자고 제안한다. 이는 회귀 결과를 바탕으로 한 연구진의 정책 해석이다. 해설상으로는 교육과 연구를 분리해 어떤 산출을 장려하는 평가체계인지 먼저 확인하는 것이 유용하다. 효율성이 낮다는 결과를 곧바로 예산 삭감이나 대학의 학문적 수준에 대한 판단으로 연결할 수는 없다.
The authors recommend reconsidering evaluation systems centred on short-term educational outcomes and discussing research autonomy, simpler administration and support for future researchers. These are policy interpretations, not experimentally tested remedies. An interpretive lesson is to ask which outputs an assessment rewards before using its score. Lower measured efficiency alone does not justify cutting budgets or judging a university’s intellectual quality.
PDF 파일 15, 16쪽PDF pages 15, 16
한계와 해석 범위Limits and interpretation
원문은 공시 자료의 제한과 단일 시점 횡단면 분석을 한계로 인정한다. 추가로 표본 수가 일치하지 않고, 표4의 일부 교육모형·규모효율성 값은 CRS·VRS의 통상적 관계와 대조가 필요하다. 이 해설 표는 비교가 명확한 종합·연구모형의 CRS·VRS 평균만 선별하고 교육모형의 문제 있는 열을 재계산한 것처럼 제시하지 않는다. 장기 생산성 변화, 분야별 연구의 질, 지역적 임무는 별도 자료가 필요하다. 원문의 정책적 설명 역시 인과적으로 확인된 작동 경로와 구분해야 한다.
The authors acknowledge disclosure-data limitations and a single cross-section. There are also unresolved sample-count differences and entries in the education/scale-efficiency columns that require reconciliation. The accompanying table therefore selects clearly transcribed overall and research CRS/VRS means rather than implying that questionable columns have been recomputed. Longitudinal productivity, research quality and regional missions require additional evidence, and the policy narrative remains interpretive.
PDF 파일 9, 11, 12, 13, 16, 17쪽PDF pages 9, 11, 12, 13, 16, 17
근거 쪽: Evidence pages: 8, 9, 10, 11, 12, 13, 14, 15, 16, 17 · PDF 파일 기준, 인쇄 쪽수와 다를 수 있습니다. · PDF file pagination may differ from printed page numbers.
원문 이미지 보기 · 1장View original document images · 1
서지 정보Bibliographic information
- 학술지Journal
- 한국경영공학회지
- 권(호)Volume (issue)
- 19(1)
- 쪽Pages
- 57–75
- 게재Published
- 2014-03-31
- 색인Indexing
-
- KCI (저자 실적 기록 기준)(per the author's records)
- 인용Citations
- Google Scholar 인용 5Cited by 5 (Google Scholar) (새 창) (opens in a new tab) (2026-09-27 기준)(as of 2026-09-27)
인용하기Cite APA · BibTeX
APA
김용희, 박영주, 최정일, 이원철 (2014). 한국 대학의 운영 효율성 평가에 관한 연구: Bootstrap DEA와 Tobit Regression을 중심으로. 한국경영공학회지, 19(1), 57–75.
BibTeX
@article{kci-2014-univ-efficiency,
  author = {김용희 and 박영주 and 최정일 and 이원철},
  title = {한국 대학의 운영 효율성 평가에 관한 연구: Bootstrap {DEA}와 Tobit Regression을 중심으로},
  journal = {한국경영공학회지},
  year = {2014},
  volume = {19},
  number = {1},
  pages = {57--75}
}