정책·산업 자료 · 원문 해설Policy & industry material · Source-based guide
플랫폼 사업자 방송통신발전기금 부과의 경제적 파급효과 분석Economic Impact Assessment of Fund Contributions by Platform Operators
김용희의 원문 역할: 연구책임Yonghee Kim’s documented role: Research lead
연구 내용Overview
플랫폼에 대한 기금 부과 확대 논의와 기업 성과의 관계를 분석하고, 여러 부과 시나리오의 파급효과를 검토한다. 원문이 밝힌 작은 표본, 낮은 통계적 유의성, 캘리브레이션 가정의 불확실성을 결과와 함께 제시해야 한다.
This report examines platform firms’ performance around discussion of expanded fund contributions and models alternative levy scenarios. Its small sample, weak statistical significance and calibration uncertainty must accompany any interpretation.
원보고서의 문제의식·분석·제안을 정리한 해설입니다. 수치는 표시한 표와 쪽을 기준으로 읽습니다. 아래 표는 핵심 항목을 웹에서 읽도록 재구성했고, 원문 표·그림이 있는 페이지를 함께 제공합니다.This reading guide explains the report’s questions, analyses, and proposals in new wording. Tables below re-present selected source results for web reading, alongside images of the relevant original pages.
핵심부터 읽기Start with the main findings
- 실증분석은 실제로 기금이 부과된 뒤의 결과를 추적한 평가와 다릅니다. 2024년 정책 논의 시점을 전후해 플랫폼 기업과 IT서비스 기업의 재무 변화를 비교합니다. 기업·시점 고정효과와 매칭으로 관측 차이를 줄였지만, 정책 논의 외의 동시 충격과 작은 기업 표본을 제거한 실험은 아닙니다.The empirical analysis is not an evaluation following actual collection of a new levy. It compares platform and IT-service firms around the 2024 policy-discussion period. Matching and firm/time effects address some observed differences, but do not create an experiment excluding simultaneous shocks or small-sample uncertainty.PDF 파일 38, 39, 42, 46, 113쪽PDF pages 38, 39, 42, 46, 113
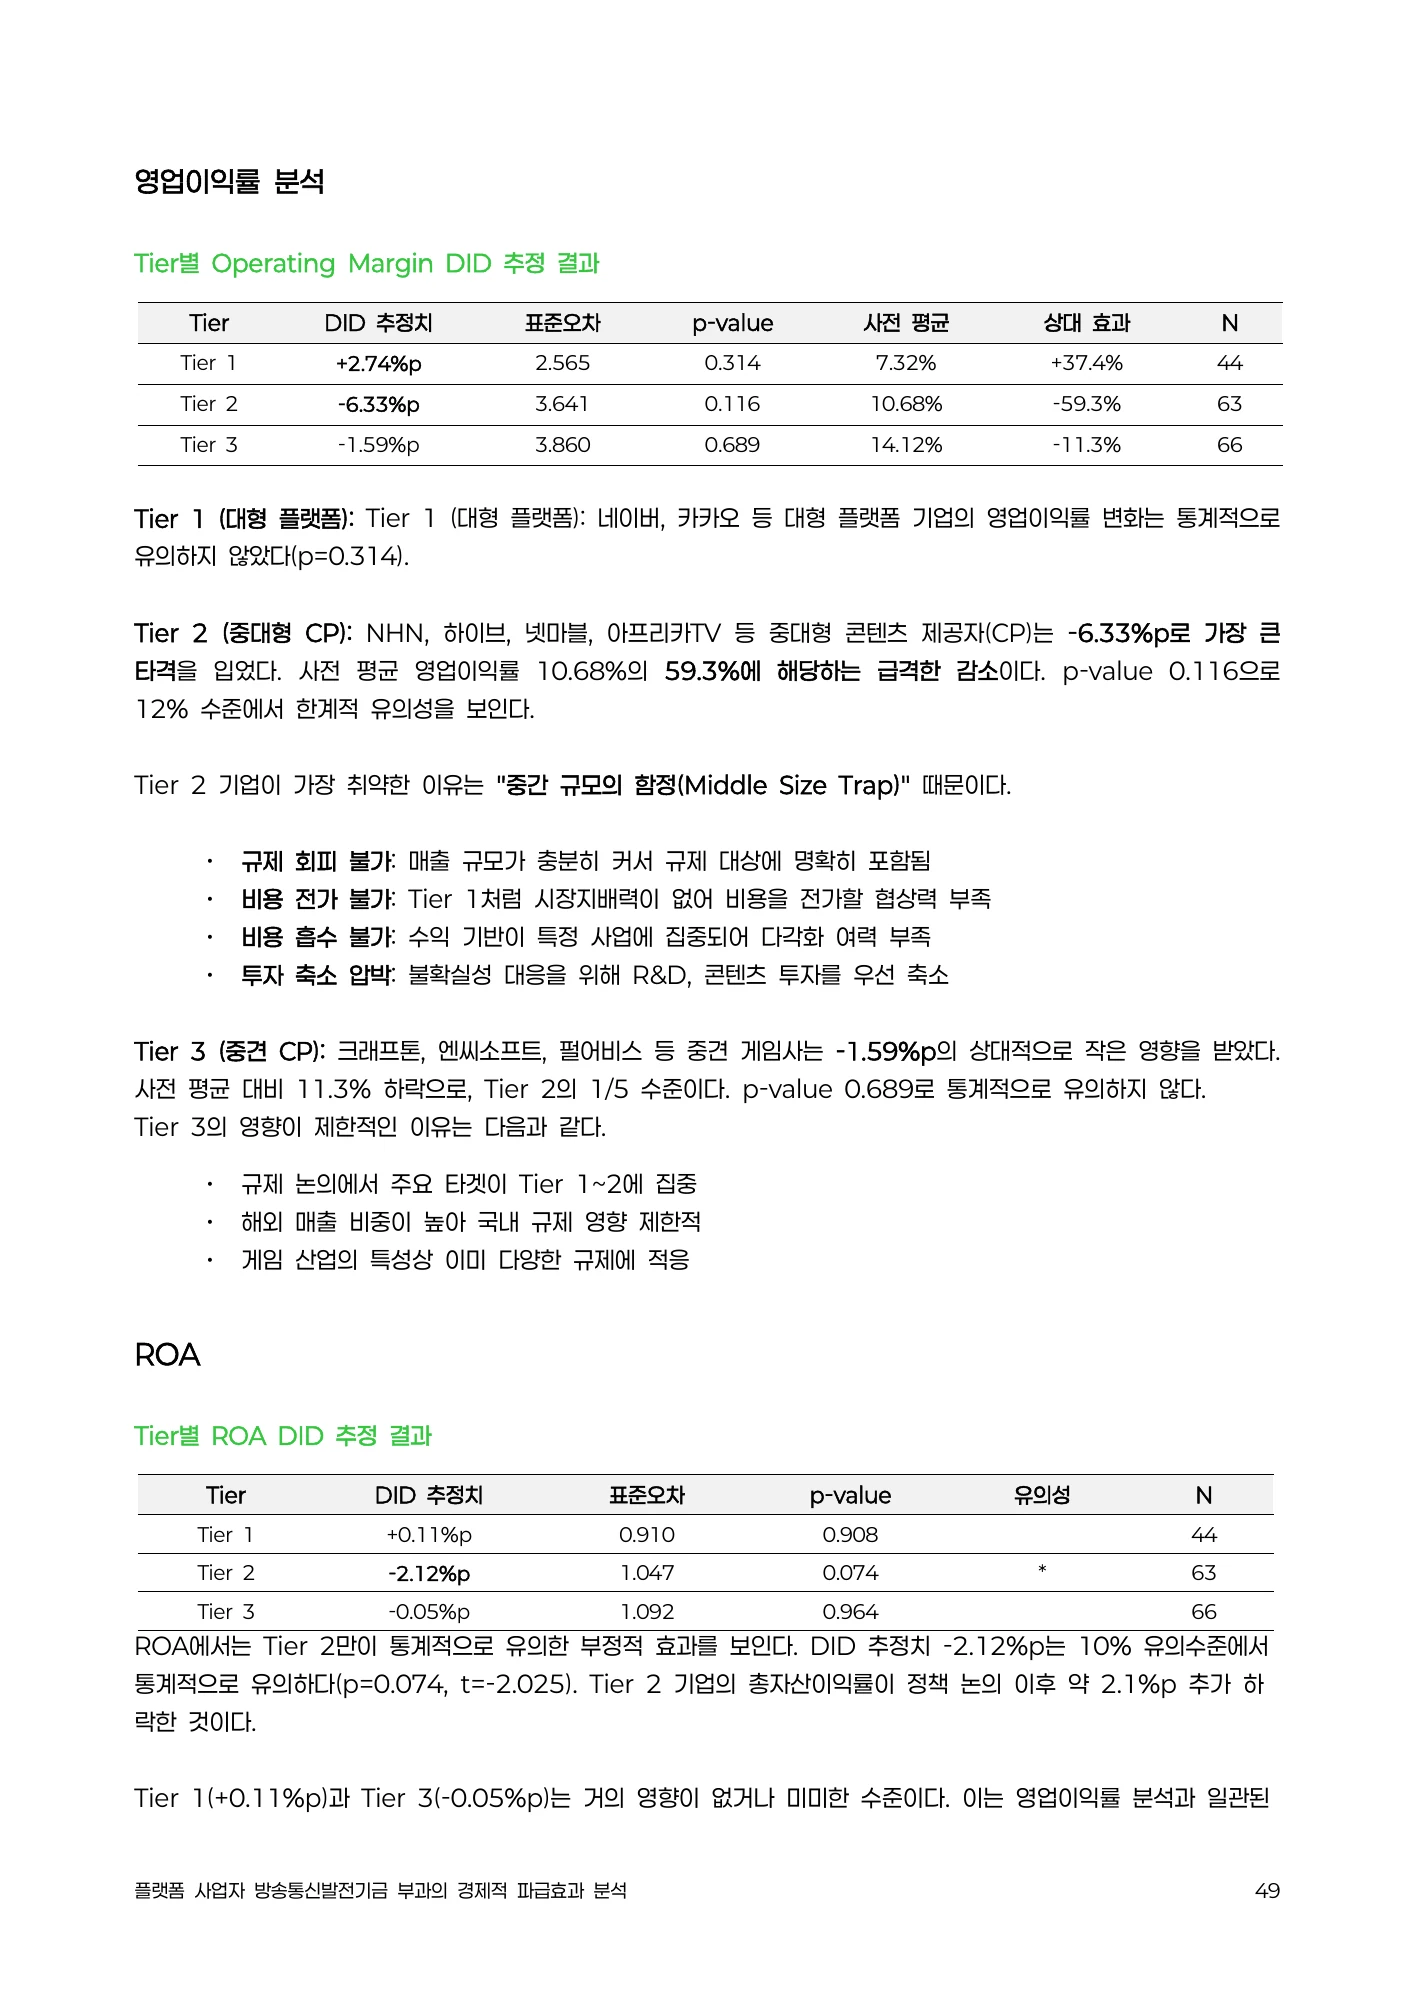
- 중간 규모 CP의 취약성은 중요한 연구 가설이지만 지표별 강도는 다릅니다. Tier 2 영업이익률 추정은 −6.33%포인트, p=.116으로 통상적인 10% 기준에서도 유의하지 않습니다. 같은 집단 ROA는 −2.12%포인트, p=.074입니다. 두 결과를 모두 확정된 규제 피해로 묶기보다 크기·불확실성·다중 비교를 함께 봅니다.Vulnerability of mid-sized content providers is an important hypothesis, but evidence differs by outcome. Tier 2 operating margin is −6.33 percentage points with p=.116, not significant even at 10%; its ROA estimate is −2.12 points with p=.074. Effect size, uncertainty and multiple comparisons matter before treating both as established regulatory damage.PDF 파일 49쪽PDF page 49
- 경제손실과 후생손실은 다른 계산입니다. 원문은 승수 4.33, 비용전가율 .55, 혁신탄력성 .85 등으로 금액을 산출합니다. 특히 혁신 손실을 10년 현재가치로 계산하면서 일부 항목은 1년 기준을 사용하므로 구성비는 기간 설계에 영향을 받습니다. 다른 절의 합계가 서로 달라 단일한 검증 금액으로 인용하지 않습니다.Economic-loss and welfare-loss calculations are distinct. Parameters include a 4.33 multiplier, .55 pass-through and .85 innovation elasticity. Innovation loss uses a ten-year present value while some components use one year, making shares period-dependent. Different sections also report different totals, preventing citation as one reconciled, verified loss amount.PDF 파일 64, 65, 67, 70, 72쪽PDF pages 64, 65, 67, 70, 72
기금 확대 논의와 기업·생태계의 부담Fund-expansion discussion and firm/ecosystem burdens
이 보고서는 플랫폼 사업자에게 방송통신발전기금 부담을 확대하는 논의가 기업 수익성과 투자, 가격, 스타트업·판매자·창작자에게 어떻게 이어질 수 있는지 묻습니다. 실제로 새 부담금을 이미 납부한 효과와 정책 논의에 대한 반응은 다릅니다. 주요 계량 분석은 정책 논의 시점을 기준으로 기업 변화를 비교하며, 뒤의 경제손실은 여러 가정으로 계산한 시나리오입니다. 따라서 제목의 '파급효과'를 이미 시행된 부과정책의 확정된 피해로 읽지 않습니다.
The report considers how expanding fund contributions to platforms could affect profitability, investment, prices and ecosystem participants. Its main empirical comparison concerns a policy-discussion period, not observed payment under an already implemented levy. Later losses are scenario calculations. The title should therefore not be read as proving realized damage from a completed reform.
PDF 파일 2, 7, 10, 105쪽PDF pages 2, 7, 10, 105
기금의 목적·수혜·부담과 이론적 경로Institutional purpose, benefit–burden links and theory
앞부분은 기금의 법적 성격, 재원·용처, 부담자와 수혜자의 관계를 검토하고 조세 귀착·후생손실·양면시장 이론을 정리합니다. 비용이 기업에 남을지, 가격이나 수수료로 넘어갈지, 연구개발을 줄일지는 서로 다른 경로입니다. 보고서는 확대보다 기존 용처의 효율화와 자발적 기여를 선호하지만 이 선호와 계량 분석으로 확인된 범위를 구분합니다. 해외 플랫폼에 대한 관할권·통상 논의도 저자의 정책 검토이지 현재 법적 불가능성의 확정 판단은 아닙니다.
Early chapters review the fund’s legal character, revenue and expenditure, benefit–burden links and tax-incidence/two-sided-market theory. Firms can absorb, pass through or adjust investment in response to costs; these are different mechanisms. The source favors spending reform and voluntary contributions, but that policy preference is distinguished from what its estimates establish.
PDF 파일 10, 24, 26, 30, 34, 35쪽PDF pages 10, 24, 26, 30, 34, 35
17개 기업, 분기자료와 매칭 표본Seventeen firms, quarterly data and matching
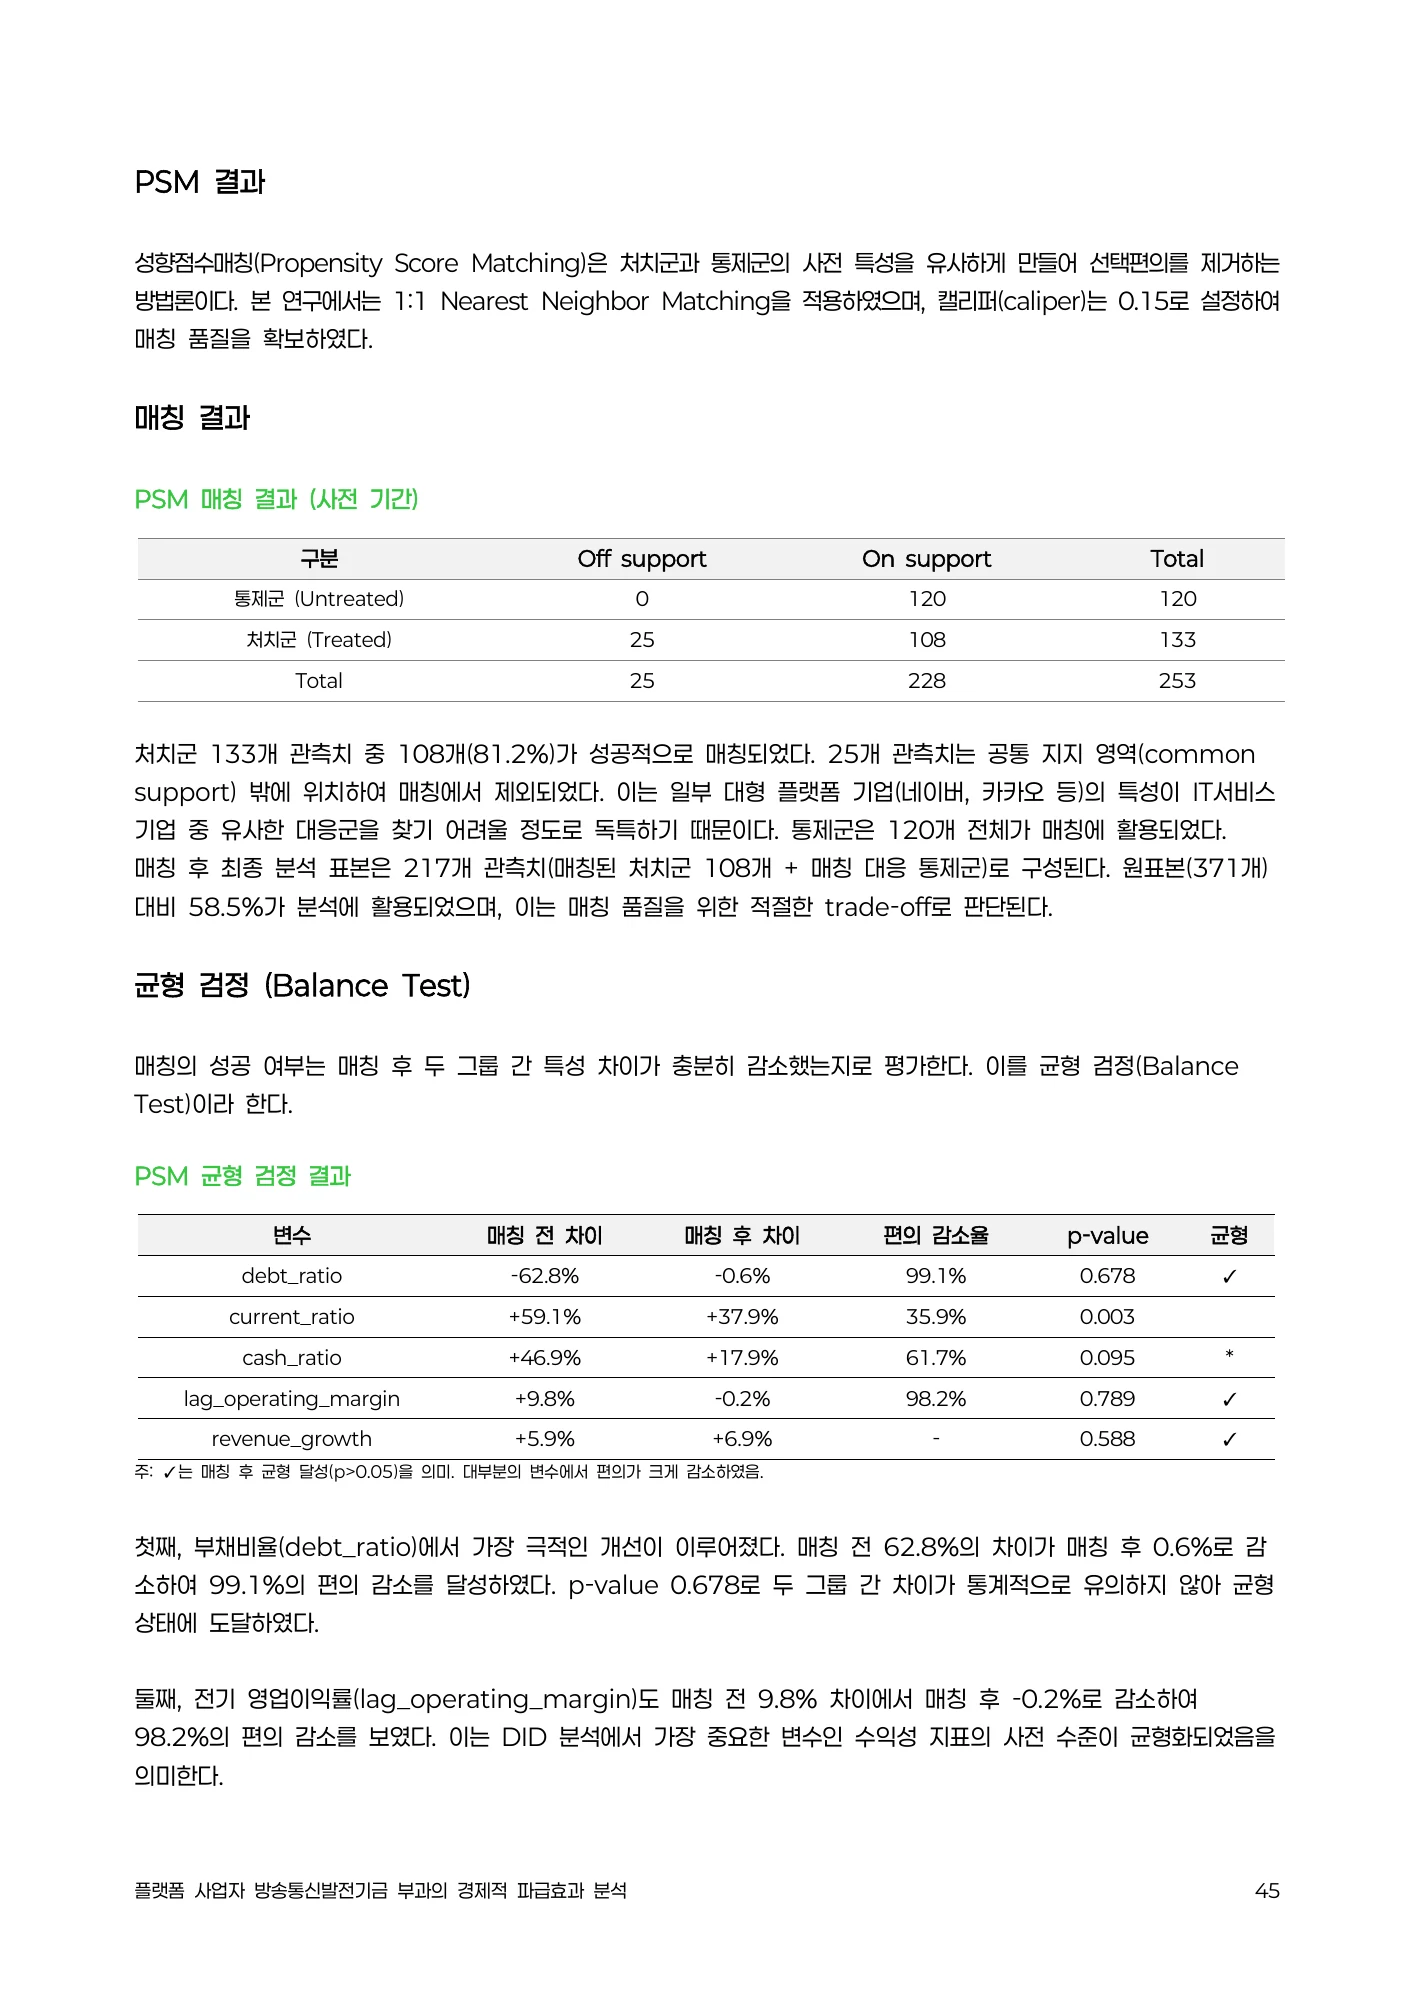
분석 범위는 플랫폼 9개와 IT서비스 8개 등 17개 기업, 2020년 1분기~2025년 2분기입니다. 원문은 개요에서 374개 관측치, 매칭 설명에서 원표본 371개와 최종 217개를 병기하므로 모형별 표본을 하나의 N으로 통일하지 않습니다. PSM은 재무 특성이 비슷한 비교 대상을 찾지만 매칭 후 유동비율 차이의 p=0.003처럼 균형이 남은 변수도 있습니다. '매칭했으므로 모든 선택편의를 제거했다'는 표현은 이 자료보다 강합니다.
The scope is 17 firms—nine platforms and eight IT-service comparators—from 2020Q1 to 2025Q2. Overview and matching passages report differing observation counts, so no single N is imposed. Matching improves comparability but residual imbalance remains, including a current-ratio difference at p=0.003. Matching does not establish removal of every selection bias.
PDF 파일 2, 7, 42, 45, 105쪽PDF pages 2, 7, 42, 45, 105
DID·이벤트·시뮬레이션의 서로 다른 역할Different roles for DID, events and simulation
기업·시점 고정효과 DID는 두 집단의 변화 차이를 비교하고, 이벤트 스터디는 특정 날짜 전후의 주가 움직임을 봅니다. 시뮬레이션은 부과율·전가율·탄력성 등의 가정을 넣어 손실을 계산합니다. 세 방법이 같은 방향을 보인다고 식별 가정이 자동 충족되는 것은 아닙니다. 평행추세, 동시 산업 충격과 기업별 군집 수, 이벤트 날짜 및 다른 뉴스, 시나리오 입력값을 각각 확인해야 하며 독립 재분석은 아직 수행하지 않았습니다.
DID compares changes across groups, event studies examine returns near selected dates, and simulations calculate outcomes under assumed rates and elasticities. Agreement in direction does not automatically validate each design. Parallel trends, concurrent shocks, clustering, event dates and calibration inputs require separate assessment; this explanation is not an independent replication.
PDF 파일 8, 42, 48, 65쪽PDF pages 8, 42, 48, 65
기본 수익성 추정은 유의하지 않음The main profitability estimate is insignificant
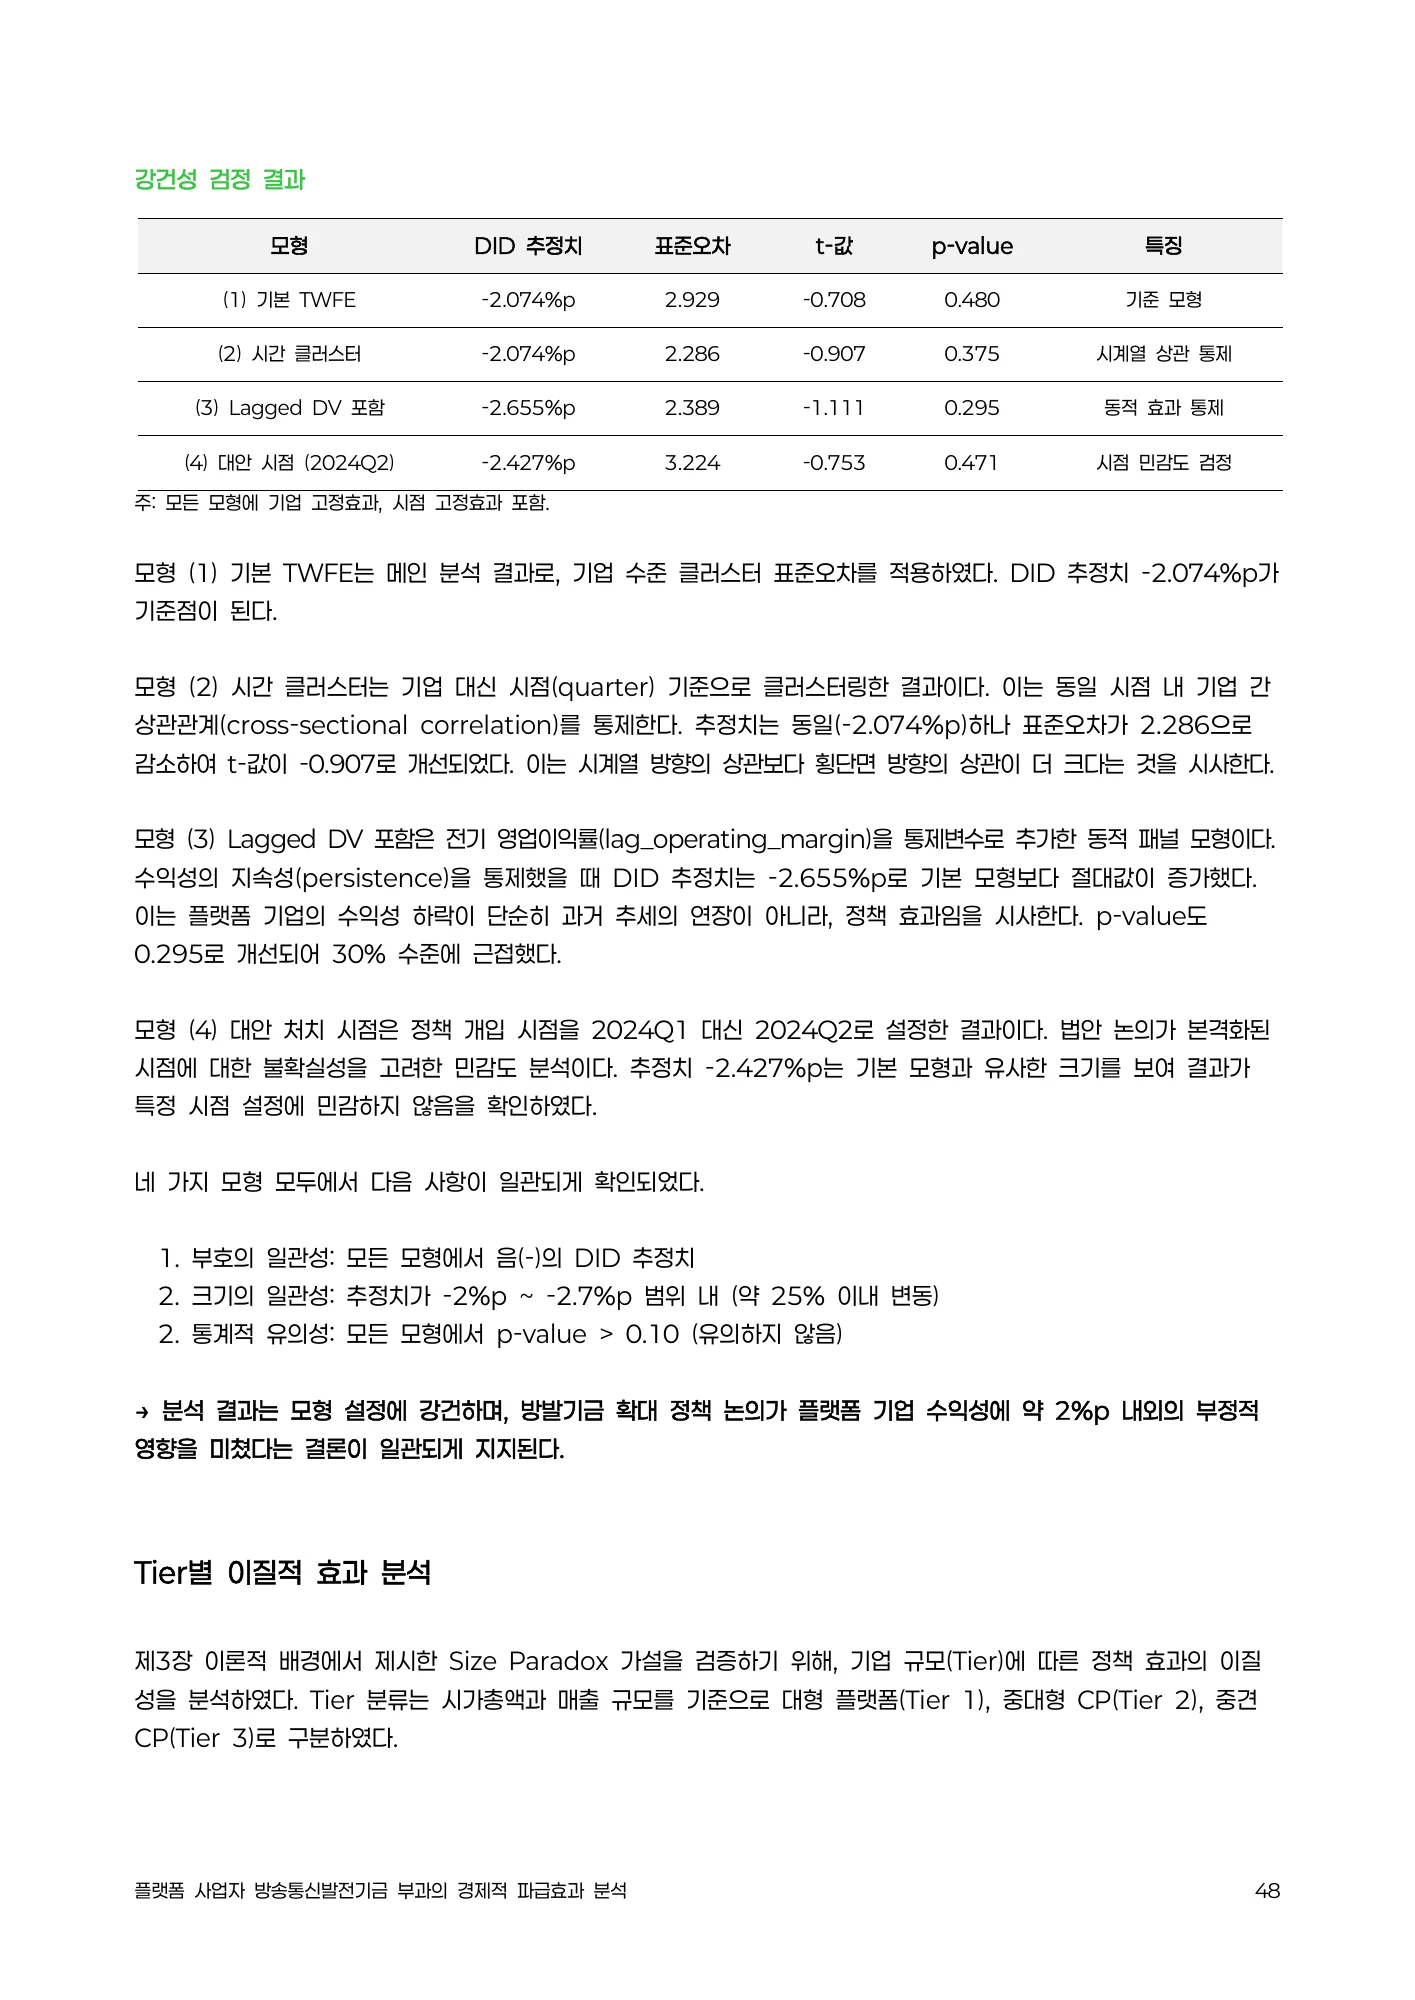
p48의 기본 TWFE 영업이익률 추정은 −2.074%p, p=0.480이며 다른 강건성 모형도 p>0.10입니다. 이는 부정적인 점추정치와 큰 불확실성을 함께 보여주는 결과입니다. 반면 결론은 p=0.497을 제시해 보고값 차이도 있습니다. 음의 부호가 반복된다는 사실만으로 정책이 수익성을 낮췄다고 검증됐다고 할 수 없습니다. 기업규모별 차이와 일부 10% 수준 결과도 탐색적·모형 의존적 결과로 구분합니다.
The p48 baseline TWFE estimate is −2.074 percentage points with p=0.480; the alternative specifications also have p>0.10. This is a negative point estimate with substantial uncertainty, not a confirmed adverse effect. The conclusion instead gives p=0.497. Subgroup patterns and marginal significance do not remove the main design’s uncertainty.
PDF 파일 48, 60, 106쪽PDF pages 48, 60, 106
손실 규모는 입력과 기간에 의존Loss estimates depend on inputs and time horizons
부과율 0.5·1.0·1.5·3.0% 등의 시나리오는 투자·가격·네트워크 효과를 계산합니다. 그러나 p65 본문은 DID −2.07%p, 각주는 R&D 계산에 −7.52%p를 적어 핵심 입력이 다릅니다. 동적 손실은 10년 현재가치, 일부 다른 손실은 1년 값이라 합산의 기간도 혼합됩니다. 그러므로 총경제손실 8,447억원이나 기금 1원당 손실 배수를 검증된 피해로 재사용하지 않고 원문 추정과 재검토 필요 사항으로만 소개합니다.
Scenarios use alternative levy rates and assumptions about price, investment and network effects. On p65 the main calibration refers to −2.07 percentage points, but a footnote uses −7.52. Ten-year discounted dynamic losses are mixed with one-year components. Headline total losses and loss-per-revenue ratios therefore require reconciliation rather than presentation as verified damage.
PDF 파일 65, 106, 107, 109쪽PDF pages 65, 106, 107, 109
스타트업·판매자·창작자·소비자 경로Channels through ecosystem participants
생태계 장은 CVC 축소, 수수료 전가와 창작자·소비자 부담을 시나리오로 논의합니다. 해외 사례는 프랑스 음악서비스, 캐나다 스트리밍, 호주 뉴스협상, 덴마크 기여제도를 비교합니다. 기업의 대응 발언·일시 중단과 실제 장기 투자 감소는 같은 자료가 아니며 한국에 같은 효과가 재현된다고 단정할 수 없습니다. 다른 분야의 조세나 뉴스협상 사례는 가능한 반응 경로를 보여주는 비교이지 이번 국내 정책의 효과를 직접 검증하는 통제집단은 아닙니다.
Ecosystem chapters discuss venture investment, seller fees and creator/consumer burdens. Foreign examples concern French music services, Canadian streaming, Australian news bargaining and Danish contributions. Statements or temporary pauses are not identical to measured long-term investment effects. These examples suggest possible responses but are not controls identifying the effect of the Korean policy discussion.
PDF 파일 80, 94, 99, 100, 101, 107쪽PDF pages 80, 94, 99, 100, 101, 107
용처 개편·자발적 매칭·단계적 설계Spending reform, voluntary matching and staged design
제언은 기존 용처와 중복 사업 점검, 성과 중심 배분, 현금·현물의 자발적 기여와 정부 매칭, 글로벌 플랫폼의 참여를 위한 제도 검토를 포함합니다. 원문 100억원+100억원의 매칭은 예시이지 확보된 재원이 아닙니다. 제안을 실제 정책으로 구체화하려면 기여의 추가성, 참여·이탈 유인, 이해상충, 지원 대상과 평가 기준을 정해야 합니다. 비용 시나리오의 불확실성뿐 아니라 지원으로 얻는 편익도 같은 기간과 기준으로 비교해야 균형 잡힌 판단이 됩니다.
Recommendations include reviewing expenditure, avoiding duplication, performance-based allocation, voluntary cash/in-kind contributions and government matching. The matching amounts are illustrative, not secured funding. Real design requires additionality, participation incentives, conflicts management and evaluation rules. Costs and support benefits should be assessed over comparable horizons.
PDF 파일 110, 111, 112쪽PDF pages 110, 111, 112
표본 정합성과 이벤트별 반응Sample balance and event-specific responses
분기 재무자료는 17개 기업·371개 기업-분기 관측치이며 매칭 뒤 주 분석은 217개 관측치를 사용합니다. 매칭 변수 중 유동비율은 표준화 차이 37.9%, p=.003으로 잔여 불균형이 남습니다. 규모 효과를 유지하려고 자산 규모와 Tier를 매칭에서 제외했다는 설계 선택도 있습니다. 따라서 매칭을 했다는 사실만으로 비교 집단이 모든 면에서 동등해졌다고 할 수 없습니다.
The financial panel contains 17 firms and 371 firm-quarter observations; the matched main analysis uses 217. The current-ratio balance measure remains 37.9% with p=.003 after matching. Asset size and Tier were deliberately omitted from matching to preserve scale effects. Matching therefore does not establish equivalence on every relevant dimension.
주가 이벤트 표의 3일 누적수익률은 사건별 방향도 다릅니다. 법안 재상정 E4에서 플랫폼 −2.06%, IT서비스 −1.01%, 차이 −1.05%포인트의 p값은 .413입니다. 다른 사건에서는 두 집단의 차이가 양수이기도 합니다. 주가가 하락했다는 사실과 그 하락이 해당 정책 때문에 비교집단보다 유의하게 컸다는 주장을 구분해야 합니다.
Three-day stock returns vary across events. At reintroduction event E4, platform returns are −2.06% versus −1.01% for IT services, a −1.05-point difference with p=.413. Other events have positive between-group differences. A negative stock return is distinct from a significant incremental decline attributable to the policy.
PDF 파일 39, 42, 45, 46, 55쪽PDF pages 39, 42, 45, 46, 55
시뮬레이션의 입력과 합계를 그대로 구분Keep simulation inputs and totals distinct
65쪽 본문 직접손실 산식은 영업이익률 변화 −2.07%포인트를 사용하지만 같은 쪽 각주의 R&D 계산은 7.52%포인트 하락을 입력합니다. 67쪽 기준 후생손실은 8,111억원인 반면 70쪽 혼합기간 비교표의 출발 합계는 8,658억원입니다. 계산 범위나 입력의 차이가 완전히 해명되지 않은 상태에서 한 수치로 합치거나 임의로 교정하지 않습니다.
Page 65’s direct-loss formula uses a −2.07-point operating-margin change, while its R&D footnote uses 7.52 points. The baseline welfare total is KRW 811.1 billion on page 67, versus KRW 865.8 billion in page 70’s mixed-period comparison. Unreconciled inputs and scope should not be combined or silently corrected.
70쪽은 정적·네트워크 손실도 10년으로 환산하면 총 후생손실이 8,658억원에서 9,386억원으로 변한다고 제시합니다. 이는 장기 혁신의 중요성을 검토하는 모형 비교이지, 실제 세수와 확정 사회손실을 같은 기간으로 비교한 완결된 비용편익분석은 아닙니다. 원문도 공익적 편익의 분석이 제한적임을 밝히므로 세입·손실 비율만으로 정책의 순편익을 확정할 수 없습니다.
Page 70 reports welfare losses rising from KRW 865.8 billion to 938.6 billion when static and network components also span ten years. This compares model horizons; it is not a completed benefit–cost analysis with realised revenue and welfare on consistent periods. The source acknowledges limited treatment of public benefits, so loss-to-revenue ratios do not settle net benefit.
PDF 파일 65, 67, 70, 113쪽PDF pages 65, 67, 70, 113
핵심 결과를 표로 읽기Read the key results in tables
| 모형Model | %pPercentage points | p |
|---|---|---|
| 기본 TWFEBaseline TWFE | −2.074 | 0.480 |
| 시간 군집Time clustering | −2.074 | 0.375 |
| 시차 종속변수Lagged outcome | −2.655 | 0.295 |
| 대안 시점Alternative timing | −2.427 | 0.471 |
p48 표 기준. 모두 10% 기준 비유의입니다. 결론 p60·106의 기본 p=.497과 차이가 있고, p65의 −7.52%p 시뮬레이션 입력은 이 표와 다릅니다.Values from p48; all are insignificant at 10%. Conclusions on p60/106 instead give p=.497. The −7.52-point calibration on p65 also differs from these estimates.
이 표를 읽는 방법How to read this table
−2.074%포인트는 수익률의 상대적 2.074% 하락과 다릅니다. 영업이익률 단위의 집단 간 전후 차이이며 표준오차 2.929로 불확실성이 큽니다. p=.480과 주 분석 표의 .497은 서로 다르지만 둘 다 통상 유의수준을 충족하지 않는다는 판단은 같습니다.A −2.074-percentage-point estimate is not a relative 2.074% decline. It is a between-group before/after difference in operating-margin units, with substantial uncertainty (SE 2.929). The .480 and .497 p-values differ across tables, but neither meets conventional significance thresholds.
군집 표준오차·시차 변수·대안 시점의 결과가 모두 음수인 것은 방향의 유사성을 보여줄 뿐 효과의 존재를 확증하지 않습니다. 이후 시뮬레이션에 이 계수의 절댓값을 넣으면 음의 추정이 금액으로 확대되므로, 가정 기반 손실과 통계적으로 확인한 정책 효과를 구별해야 합니다.Negative signs across clustering, lagged-outcome and timing variants show directional similarity, not confirmation of an effect. Passing the absolute estimate into a simulation scales a negative estimate into money; modelled loss must remain distinct from a statistically established policy effect.
PDF 파일 46, 48, 65쪽PDF pages 46, 48, 65
원문 p48 강건성 표 발췌Selected entries from the original robustness table on p48 · PDF 파일 48, 60, 65, 106쪽PDF pages 48, 60, 65, 106
원문의 핵심 표·그래프Key tables & figures in the source
표·그림이 수록된 원문 페이지입니다. 이미지를 누르면 확대할 수 있습니다.Original pages containing the selected tables or figures. Select an image to enlarge it.
매칭 이후 남은 집단 차이Residual differences after matching
기본 및 강건성 DID 결과DID and robustness estimates
기업 규모별 수익성 추정과 p값Profitability estimates and p-values by firm tier
분석기간 통일 전후의 후생손실Welfare-loss comparison before and after horizon alignment
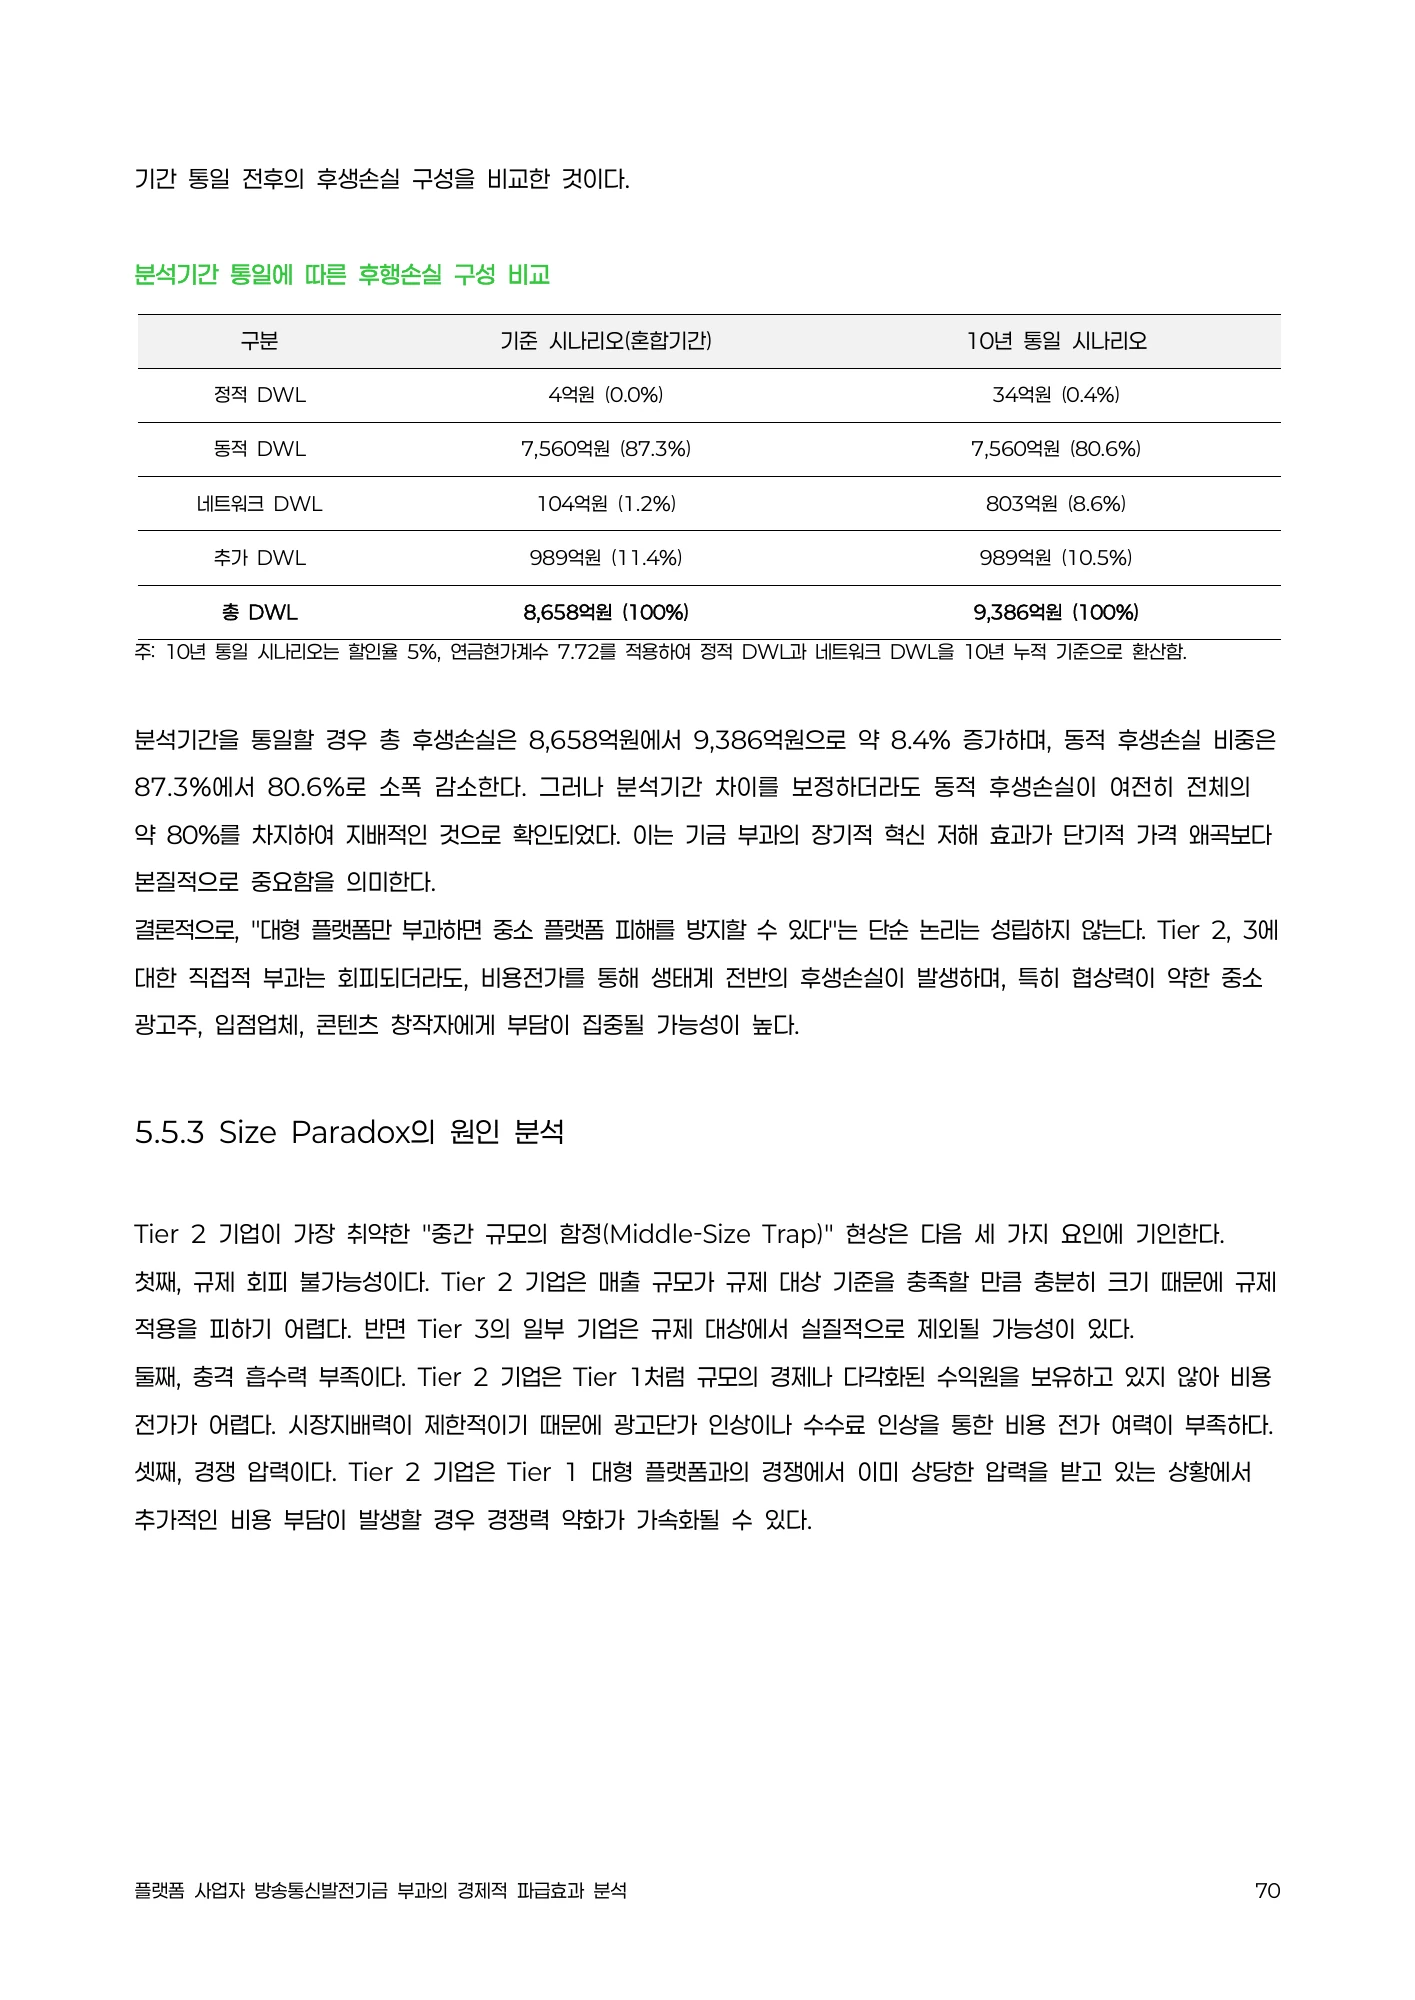
정책 논의 효과와 부과 효과를 구분Separate discussion-period associations from levy effects
작은 기업 표본, 잔여 매칭 불균형, 정책 논의라는 불명확한 처치, 유의하지 않은 기본 추정, p값과 캘리브레이션 입력의 충돌이 남습니다. 같은 계수를 후속 손실 계산에 쓰면 불확실성도 전달되어야 합니다. 원문의 강한 결론을 그대로 단정하지 않고 수치의 단위·기간·추정 성격을 유지했습니다. 연구책임 표기는 원문 p2에서 확인되지만, 이는 모든 결과가 재현 검증됐다는 의미가 아니며 발주 관계나 현행 법령 상태를 추가 확정하지 않습니다.
Limitations include few firms, residual imbalance, an ambiguous discussion-period treatment, insignificant main estimates and conflicting p-values and calibration inputs. Uncertainty should propagate into downstream simulations. The source names a research lead, but that does not certify replication. Strong policy conclusions are kept distinct from the numerical evidence and its reporting problems.
PDF 파일 2, 45, 48, 65, 106쪽PDF pages 2, 45, 48, 65, 106
근거 쪽: Evidence pages: 2, 7, 8, 10, 24, 26, 30, 34, 35, 38, 39, 42, 45, 46, 48, 49, 55, 60, 64, 65, 67, 70, 72, 80, 94, 99, 100, 101, 105, 106, 107, 109, 110, 111, 112, 113 · PDF 파일 기준, 인쇄 쪽수와 다를 수 있습니다. · PDF file pagination may differ from printed page numbers.
근거와 검토 범위Source and review scope
115쪽의 제공된 원문 자료를 기준으로 본문·표·선정 이미지를 확인했습니다. 해설은 연구 내용을 새 문장으로 정리했으며, 실제 원문 페이지를 함께 실었습니다. 분석 결과의 독립 재현이나 기관의 공식 입장 확인을 뜻하지 않습니다.
The text, tables and selected images were checked against the 115-page source document supplied for this site. This guide is an editorial summary accompanied by original source pages. This does not imply independent replication or institutional endorsement.
확인한 PDF 쪽: Source PDF pages: 1, 2, 7, 8, 10, 24, 26, 30, 34, 35, 38, 39, 42, 45, 46, 48, 49, 55, 60, 62, 63, 64, 65, 67, 70, 72, 80, 94, 99, 100, 101, 105, 106, 107, 109, 110, 111, 112, 113