정책·산업 자료 · 원문 해설Policy & industry material · Source-based guide
홈쇼핑 규제 합리화를 위한 실증 분석 보고Empirical Review of Home-Shopping Regulation
김용희의 원문 역할: 자료 말미 기명Yonghee Kim’s documented role: Named contributor at the end of the document
연구 내용Overview
중소기업 의무편성·직매입·수수료를 2019–2023년 패널 분석과 시나리오·이해관계자 의견으로 검토한다. 설문 인원, 일부 변수명과 해석, 모의실험 금액 단위에 충돌이 있어 관련 수치는 재확인이 필요하다.
A review of SME programming, direct purchasing and commissions using 2019–2023 panel analysis, scenarios and stakeholder views. Conflicts in survey counts, a variable label and its interpretation, and simulation currency units require checking.
원보고서의 문제의식·분석·제안을 정리한 해설입니다. 수치는 표시한 표와 쪽을 기준으로 읽습니다. 아래 표는 핵심 항목을 웹에서 읽도록 재구성했고, 원문 표·그림이 있는 페이지를 함께 제공합니다.This reading guide explains the report’s questions, analyses, and proposals in new wording. Tables below re-present selected source results for web reading, alongside images of the relevant original pages.
핵심부터 읽기Start with the main findings
- 의무편성이 중소기업 지원이라는 목표를 달성하는지 보려면 전체 편성량과 신규 업체 진입을 나누어야 합니다. 분석에서는 전체 중기 편성과 프라임시간 편성의 계수 방향이 다르게 나타납니다. 중소기업이라는 이름으로 묶인 기존 상위 업체가 더 많은 시간을 얻는 것과 새 기업이 진입하는 것은 같은 성과가 아닙니다.Assessing mandatory SME programming requires separating total airtime from new-supplier entry. The analysis finds different coefficient directions for overall and prime-time SME scheduling. More airtime for established leading SMEs is not the same outcome as entry by new firms.PDF 파일 29, 31, 32, 33, 51쪽PDF pages 29, 31, 32, 33, 51
- 수수료 분석도 정액제가 항상 좋고 정률제가 항상 나쁘다는 결론이 아닙니다. 전체 취급고와 중소기업 취급고 비율은 서로 다른 종속변수이며, 전체 시간대와 프라임시간대의 관계도 다릅니다. 계수·표준오차·p값을 함께 읽고 변수의 비율 단위를 확인해야 사업자가 바꿔야 할 수수료 정책을 논의할 수 있습니다.The fee analysis does not establish that flat fees are always beneficial and percentage fees always harmful. Total transaction value and the SME share are different outcomes; overall and prime-time conditions also differ. Coefficients, uncertainty and variable scales need to be read together before drawing fee-policy implications.PDF 파일 44, 45, 47, 48쪽PDF pages 44, 45, 47, 48
- 생방송 확대와 의무판매비중 조정은 실제 제도 변경 뒤의 평가가 아니라 가정한 반응식으로 계산한 모의실험입니다. 특히 생방송 3→24시간 모형은 T커머스 성장률·이익률을 올리고 홈쇼핑은 낮추는 계수를 직접 지정합니다. 결과의 방향이 모형 입력에 포함되어 있으므로 예측 그래프만으로 규제 완화의 효과가 검증됐다고 볼 수 없습니다.Live-broadcast expansion and quota changes are simulations under assumed response rules, not evaluations after an implemented reform. The 3-to-24-hour model directly specifies increases in T-commerce growth and margin and decreases for home shopping. The direction is partly built into the inputs, so output charts do not independently verify deregulation effects.PDF 파일 35, 36, 40, 41쪽PDF pages 35, 36, 40, 41
의무편성이 실제로 새로운 중소기업을 돕는가Do programming requirements help new SME suppliers?
이 보고서는 데이터홈쇼핑의 중소기업 편성 조건, 직매입, 수수료와 생방송 시간 규제를 함께 검토한다. 중심 질문은 중소기업 상품의 방송 비율을 높이는 것이 신규 납품업체의 진입과 다양한 기업의 판매 기회로 이어지는가이다. 중소기업 전체와 기존 상위 업체의 이익이 다를 수 있다는 점을 구분한다. 정량 분석과 모의실험, 이해관계자 설문·FGI를 결합한 발표형 자료이며, 마지막 저자 연락처에는 김용희가 OpenRoute 연구위원으로 기재된다. 연구 참여와 개별 정책의 채택 실적은 구분한다.
The report examines SME programming conditions, direct purchasing, commissions and live-broadcast limits in data home shopping. Its question is whether more SME airtime creates opportunities for new and diverse suppliers, rather than mainly benefiting established firms. It combines regression, simulation, questionnaires and focus-group-style material in a presentation format. The author-contact page names Yonghee Kim as an OpenRoute researcher; authorship does not itself establish policy adoption.
PDF 파일 2, 3, 16, 27, 73, 74쪽PDF pages 2, 3, 16, 27, 73, 74
패널 자료와 조사 자료의 범위Panel and stakeholder evidence
정량 부분은 2019–2023년 승인 조건 관련 패널 자료를 사용한다고 설명한다. 신규 업체 수·비율, 취급고, 상위 중소기업 편성 등을 종속변수로 두고 전체·프라임 시간 중소기업 편성, 수수료, 직매입 등과의 관계를 분석한다. 설문은 2024년 9월 1–20일 조사로 제시된다. 다만 본문은 응답자 120명을 쓰면서 집단별 인원 합계는 110명이고, 표의 전문가 수는 20명 또는 25명으로 달라진다. 따라서 정확한 전체 표본 수가 확정된 대표 조사처럼 소개하지 않고, 표본 설명의 충돌을 함께 표시한다.
The quantitative section describes a 2019–2023 panel of approval-condition data, linking entry, transaction volume and leading suppliers’ airtime with programming, commissions and direct purchasing. The stakeholder survey is dated September 1–20, 2024. Its sample description conflicts internally: a stated total of 120 accompanies subgroup counts summing to 110, while tables show differing expert counts. A single confirmed representative sample size is therefore not assigned.
PDF 파일 27, 28, 29, 59, 60쪽PDF pages 27, 28, 29, 59, 60
고정효과 분석은 무엇을 비교하는가What the fixed-effects analysis compares
고정효과 회귀는 사업자별로 쉽게 변하지 않는 특성을 고려하면서 시간에 따른 지표의 변화를 비교하는 방식이다. 보고서는 신규 전체 납품업체와 신규 중소 납품업체를 구분해 여러 모형을 제시한다. 이런 통제는 단순한 평균 비교보다 구체적이지만, 시장 변화와 편성 결정이 동시에 달라지는 문제를 모두 해결하지는 못한다. 원문이 계수를 '1% 증가'의 효과로 설명하더라도 비율의 입력 단위가 확인되지 않으면 1%와 1%포인트를 바꾸어 해석할 수 없다. 웹 표는 원문 계수 단위를 유지한다.
Fixed effects compare changes over time while accounting for relatively stable operator characteristics. Separate models examine all new suppliers and new SME suppliers. This is more specific than comparing averages, but it does not remove every source of simultaneous change in markets and programming decisions. The source’s percentage interpretations also require input-unit verification. The table therefore retains model coefficients rather than converting them into percentage-point policy effects.
PDF 파일 28, 29, 31, 33, 45, 50, 51쪽PDF pages 28, 29, 31, 33, 45, 50, 51
신규 진입 결과는 모형에 따라 다르다Entry results differ across models
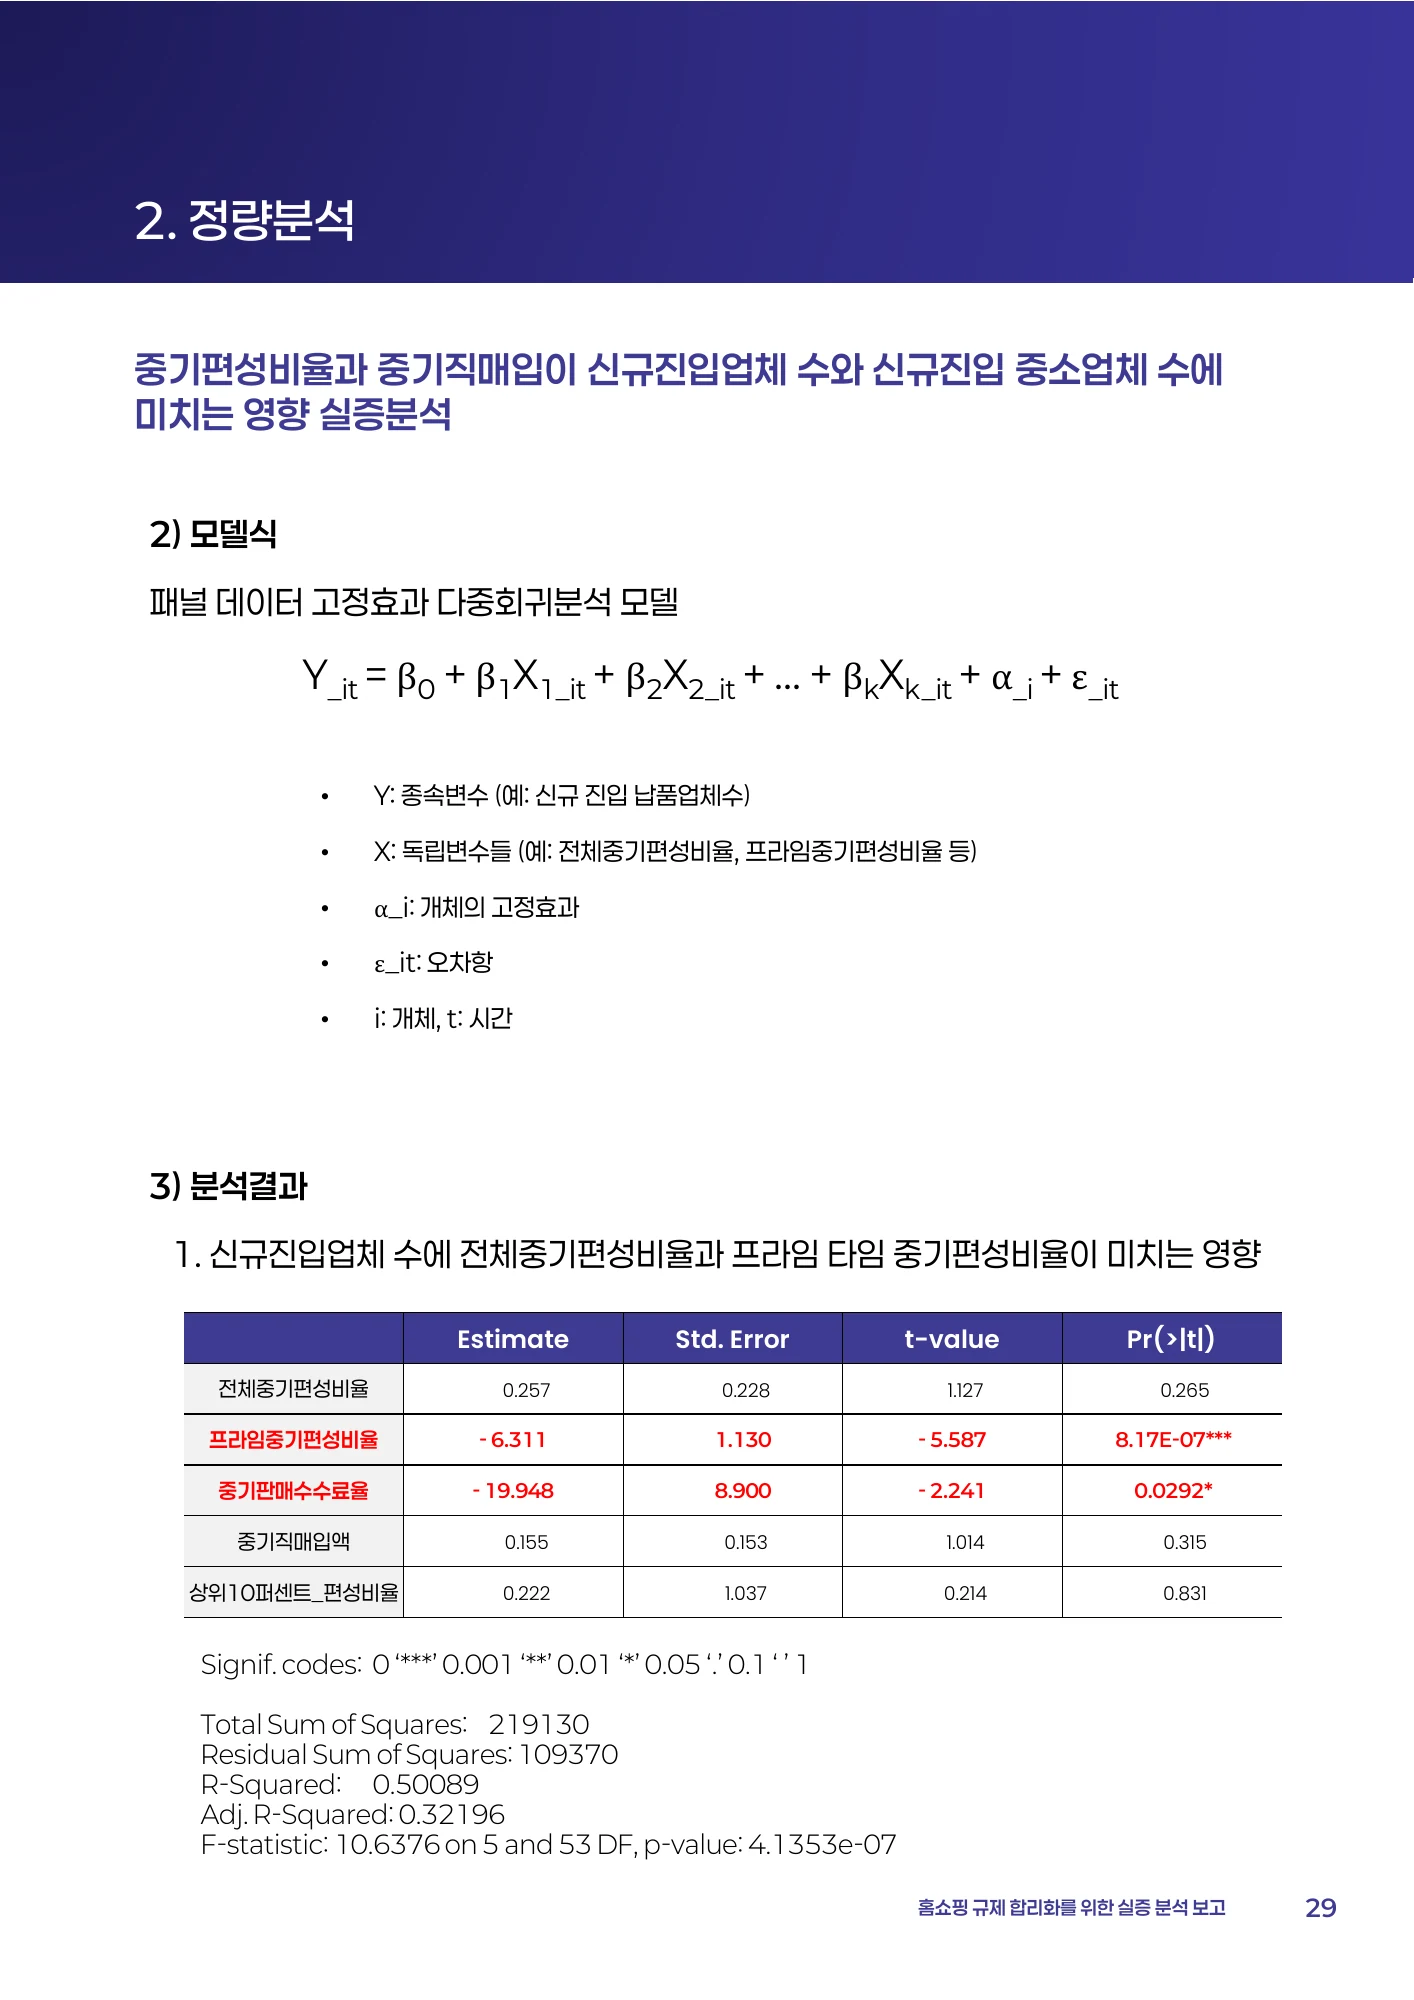
전체 신규 업체 수 모형에서 전체 중소기업 편성 계수는 0.257(p=0.265)으로 유의하지 않고 프라임 편성은 −6.311(p=8.17×10⁻⁷)로 음의 관계를 보인다. 신규 중소업체 수 모형에서는 전체 편성이 0.407(p=0.010), 프라임 편성이 −5.589(p가 0.000으로 반올림 표기)이다. 이 차이는 편성을 하나의 숫자로만 평가하기 어렵다는 근거로 읽을 수 있다. 그러나 관측 관계를 곧바로 규제 완화의 인과 효과로 바꾸거나, 모든 중소기업에 같은 결과가 발생한다고 확대하지 않는다.
For all new suppliers, the overall SME-programming coefficient is 0.257 (p=.265), while prime-time programming is −6.311 (p=8.17×10⁻⁷). For new SME suppliers, the corresponding coefficients are 0.407 (p=.010) and −5.589 (p rounded to .000). These distinctions support examining programming conditions separately. They remain observational model results, not identified causal effects of deregulation or predictions applying uniformly to every SME.
PDF 파일 29, 30, 31, 33쪽PDF pages 29, 30, 31, 33
상위 업체 편중과 수수료의 서로 다른 관계Concentration and different commission relationships
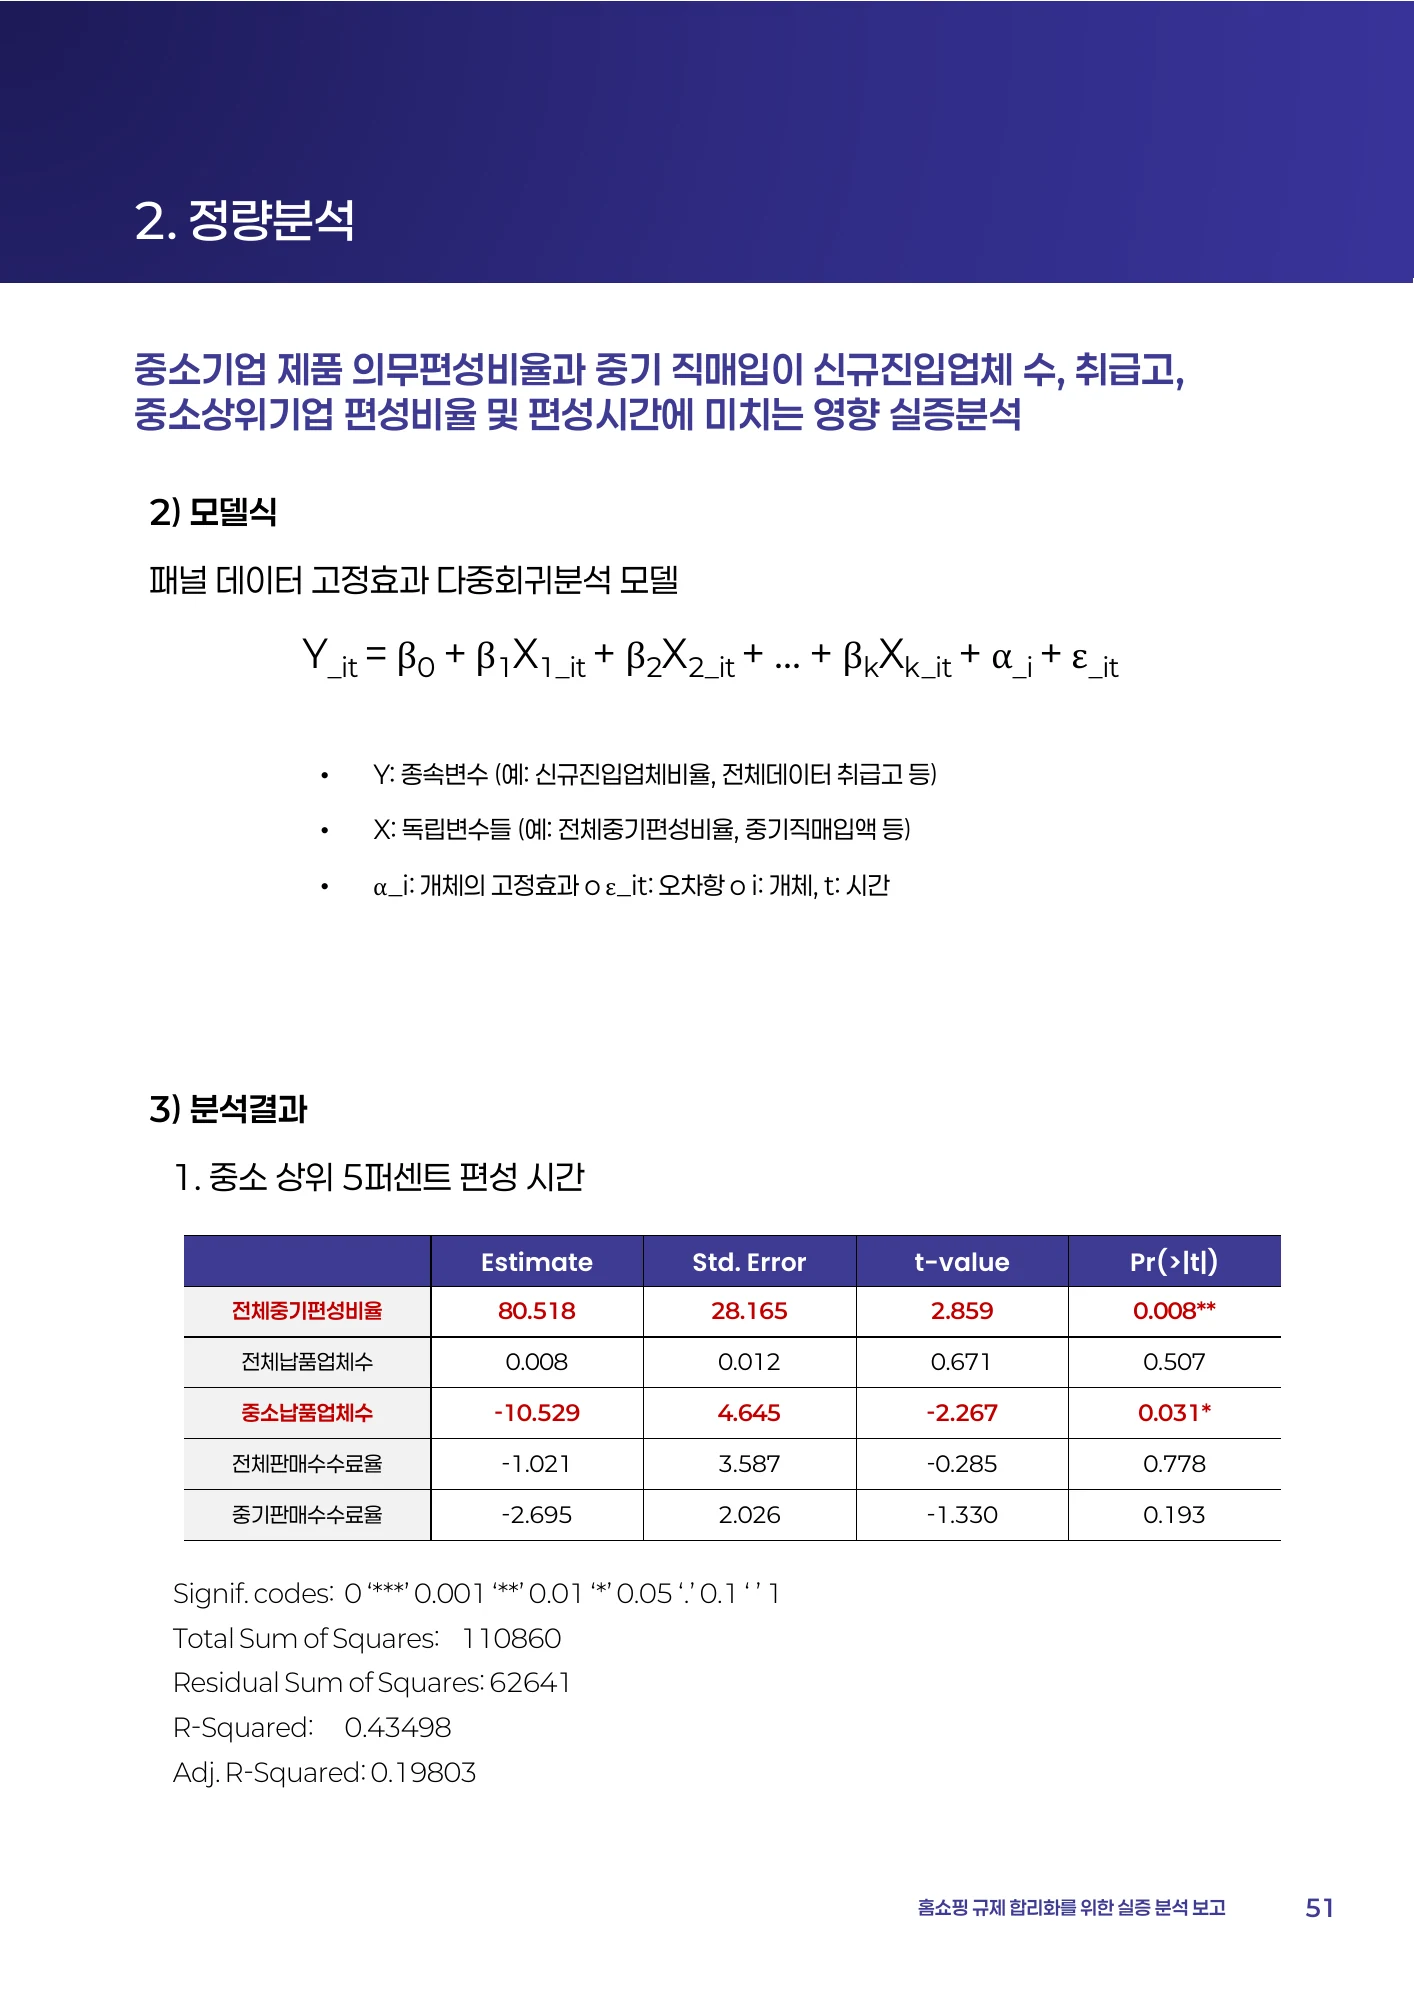
후반 분석은 의무편성과 지원의 수혜자가 누구인지 묻는다. 상위 5% 중소업체 편성시간 모형에서 전체 편성 계수는 80.518(p=0.008)로 제시되어, 총량 확대와 기회 분산이 다른 목표일 수 있음을 보여 준다. 수수료 모형에서는 정액·정률과 프라임 시간 여부에 따라 관계와 유의성이 다르다. 한편 53쪽 표의 첫 변수는 전체중기편성비율인데 설명은 같은 계수를 중기직매입액의 효과라고 해석한다. 이 충돌 때문에 해당 0.012를 직매입의 확정 효과로 재사용하지 않았다.
Later models ask who benefits. Overall SME programming is associated with leading SMEs’ airtime at a coefficient of 80.518 (p=.008), illustrating the distinction between expanding volume and dispersing opportunities. Commission associations vary by payment form and time slot. Page 53 also labels its first coefficient as programming share but interprets it as direct purchasing. That 0.012 coefficient is consequently not presented as a confirmed direct-purchase effect.
PDF 파일 45, 46, 50, 51, 52, 53, 55쪽PDF pages 45, 46, 50, 51, 52, 53, 55
모의실험 결과와 실제 시장 변화의 구분Separating simulations from observed market change
의무 판매 비율 조정과 생방송 시간 확대는 별도의 모의실험으로 검토한다. 모의실험은 가정한 매출·마진·반응식을 여러 조건에 적용해 결과를 계산하는 방법으로, 실제 제도 변경을 관찰한 분석과 다르다. 특히 생방송 모형에는 시간 증가에 따른 성장률과 이익률 변화를 고정한 식이 들어간다. 41쪽은 이익이 매출보다 훨씬 크게 표시되는 등 금액 단위에도 문제가 있어 총이익 증가액을 신뢰할 수 있는 시장 전망으로 옮기지 않았다. 방향성 역시 입력한 가정에 의존한다.
Separate simulations examine compulsory sales shares and longer live-broadcast hours. They calculate outcomes from assumed revenues, margins and response rules rather than observing an actual policy change. The live-hours model explicitly assigns changes in growth and profit margins. Page 41 reports profit amounts far exceeding revenue, indicating unresolved unit problems. Its aggregate profit changes are therefore not reused as reliable forecasts; even simulated directions depend on the chosen assumptions.
PDF 파일 35, 36, 37, 38, 40, 41쪽PDF pages 35, 36, 37, 38, 40, 41
이해관계자 의견과 모바일 전환Stakeholder views and the shift to mobile commerce
설문과 FGI는 사업자·납품업체·전문가의 이해가 다르다는 점을 보여 주는 자료다. 규제 완화나 수수료 상한, 직매입에 대한 태도는 집단별로 다르게 제시되고, 정성 인용은 이미 온라인·모바일·라이브커머스로 판매가 이동하고 있다는 인식을 담는다. 이 발언을 전체 중소기업의 통계적 견해로 바꾸거나 모든 업체의 채널별 매출 구성으로 일반화할 수는 없다. 특히 표본 구성의 충돌이 있으므로 비율보다 관점의 차이와 후속 확인이 필요한 쟁점에 초점을 맞췄다.
Questionnaires and qualitative quotations illustrate differing interests among platforms, suppliers and experts concerning deregulation, commission caps and direct purchasing. Several accounts describe a shift toward online, mobile and live commerce. These views cannot be generalised into population-level SME attitudes or universal sales-channel shares. Given conflicting sample descriptions, the interpretation emphasises differences in perspective and questions for follow-up rather than presenting precise survey percentages as settled facts.
PDF 파일 59, 60, 61, 62, 63, 65, 69, 70쪽PDF pages 59, 60, 61, 62, 63, 65, 69, 70
지원의 질과 단계적 제도 개선Quality of support and phased reform
결론은 단순한 편성 비율 유지보다 신규 상품 발굴과 실질적인 지원, 유연한 수수료, 단계적 생방송 확대와 소비자 보호, TV·모바일·온라인을 연결하는 전략을 제안한다. 보고서의 정책적 가치는 중소기업이라는 한 범주 안에서도 신규·기존·상위 업체의 조건이 다름을 묻는 데 있다. 실행하려면 편성시간뿐 아니라 신규 업체의 생존과 판매, 거래 조건을 함께 점검해야 한다. 이는 원문의 제안과 분석에서 도출하는 검토 방향이며, 해당 정책이 이미 시행되거나 순편익이 입증되었다는 결과가 아니다.
Recommendations favour useful support and product discovery over maintaining a single programming percentage, alongside flexible commissions, phased live broadcasting with consumer safeguards and integration across sales channels. The useful policy distinction is between new, established and leading SMEs. Implementation would require examining supplier survival, sales and contractual terms as well as airtime. These are recommendations and evaluation questions, not evidence that reforms were enacted or produced net benefits.
PDF 파일 55, 69, 70, 73쪽PDF pages 55, 69, 70, 73
취급고와 중소기업 몫에 대한 수수료 관계Fee relationships for transaction value and the SME share
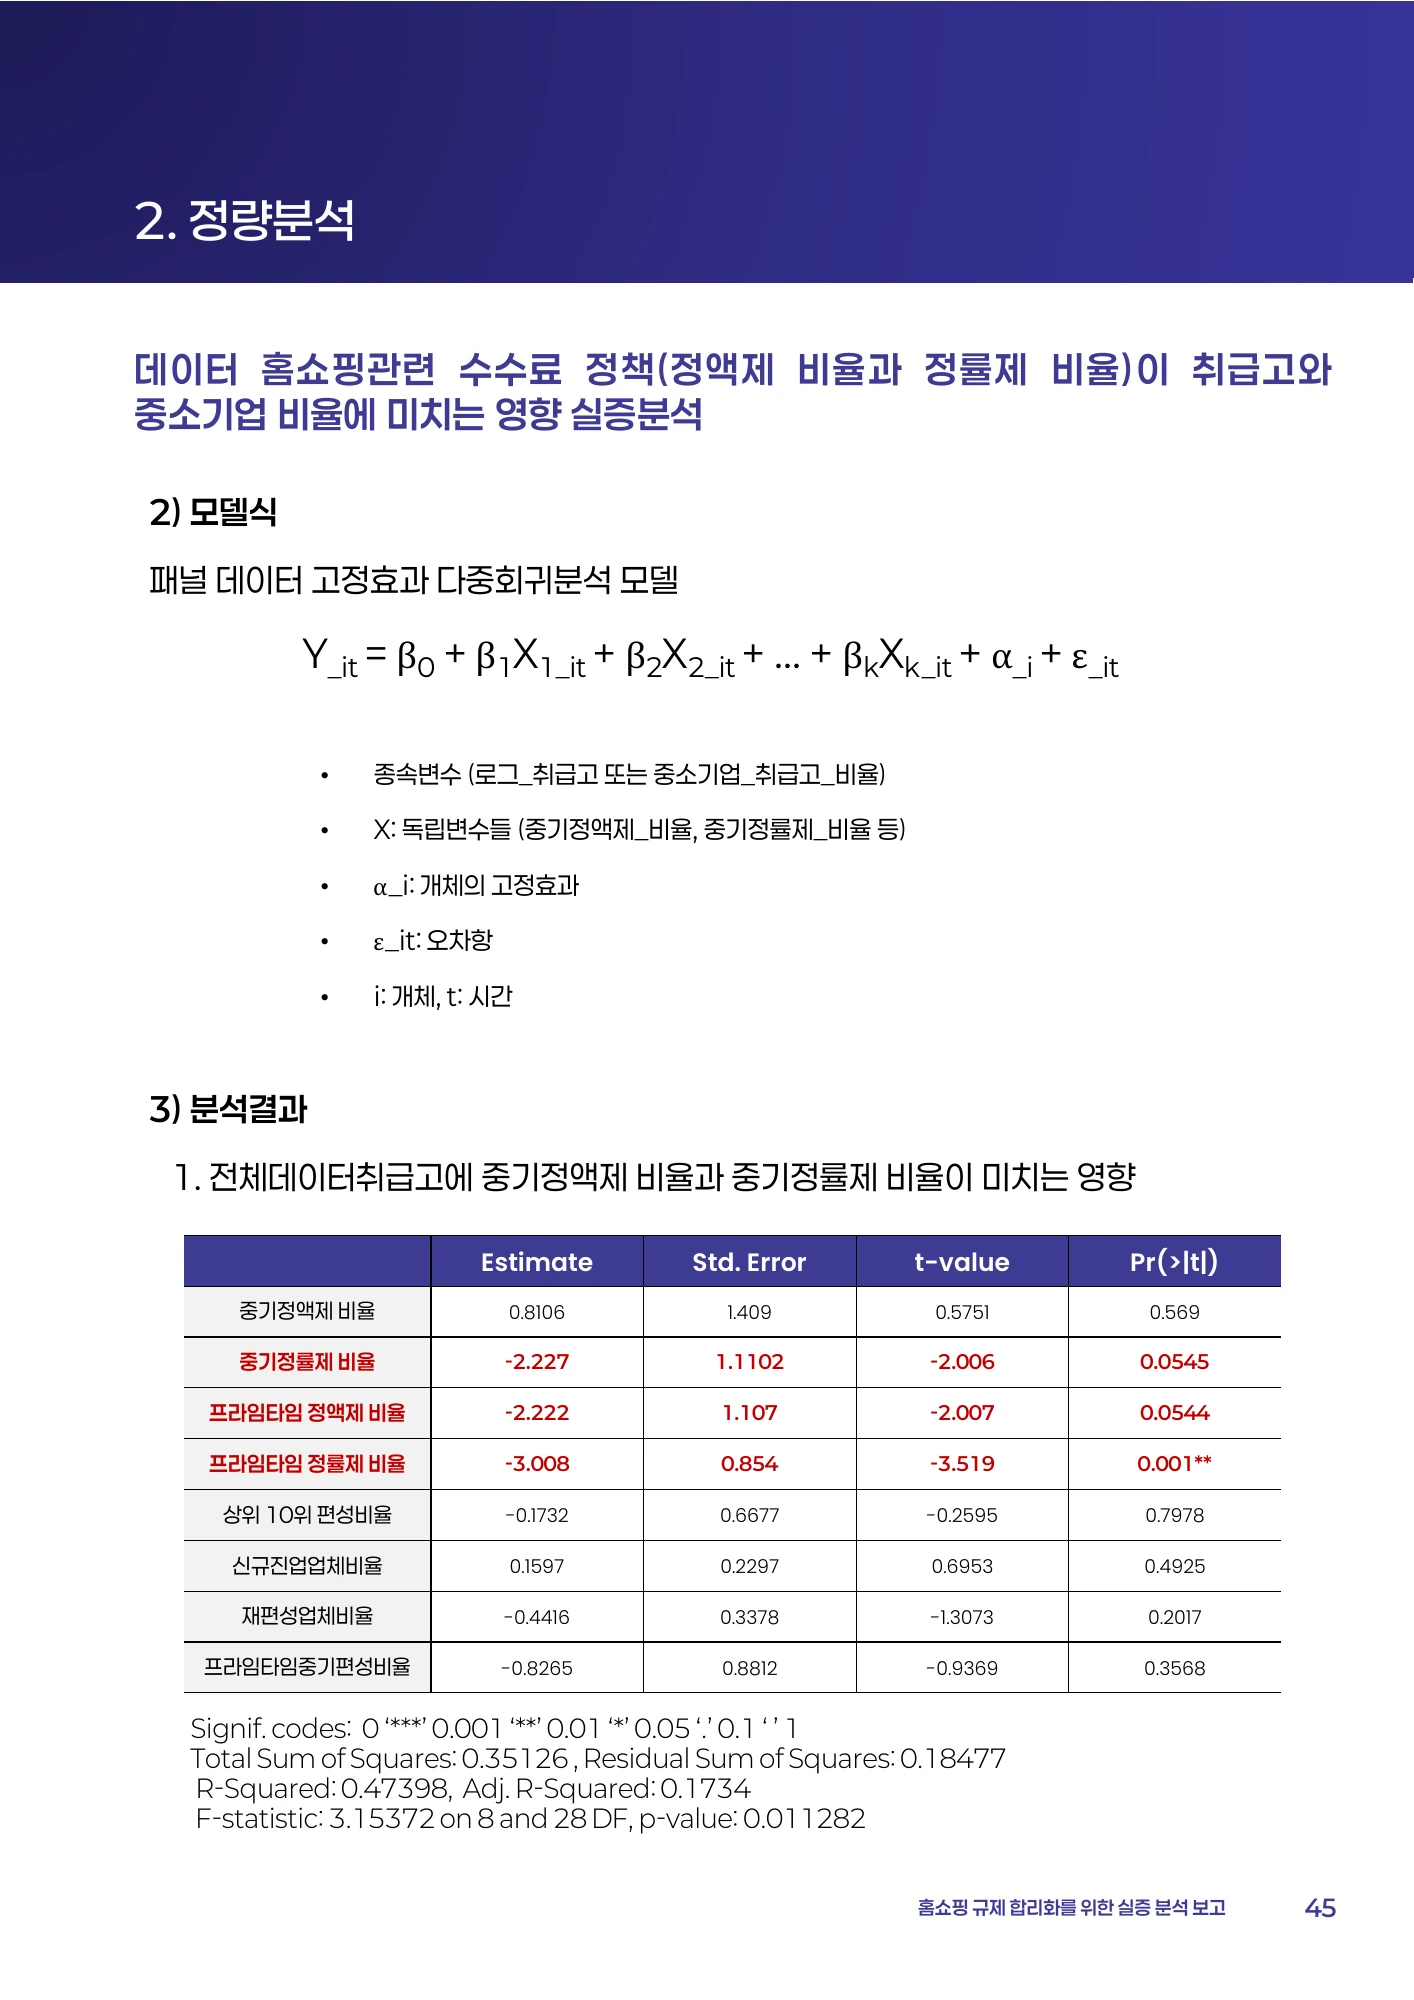
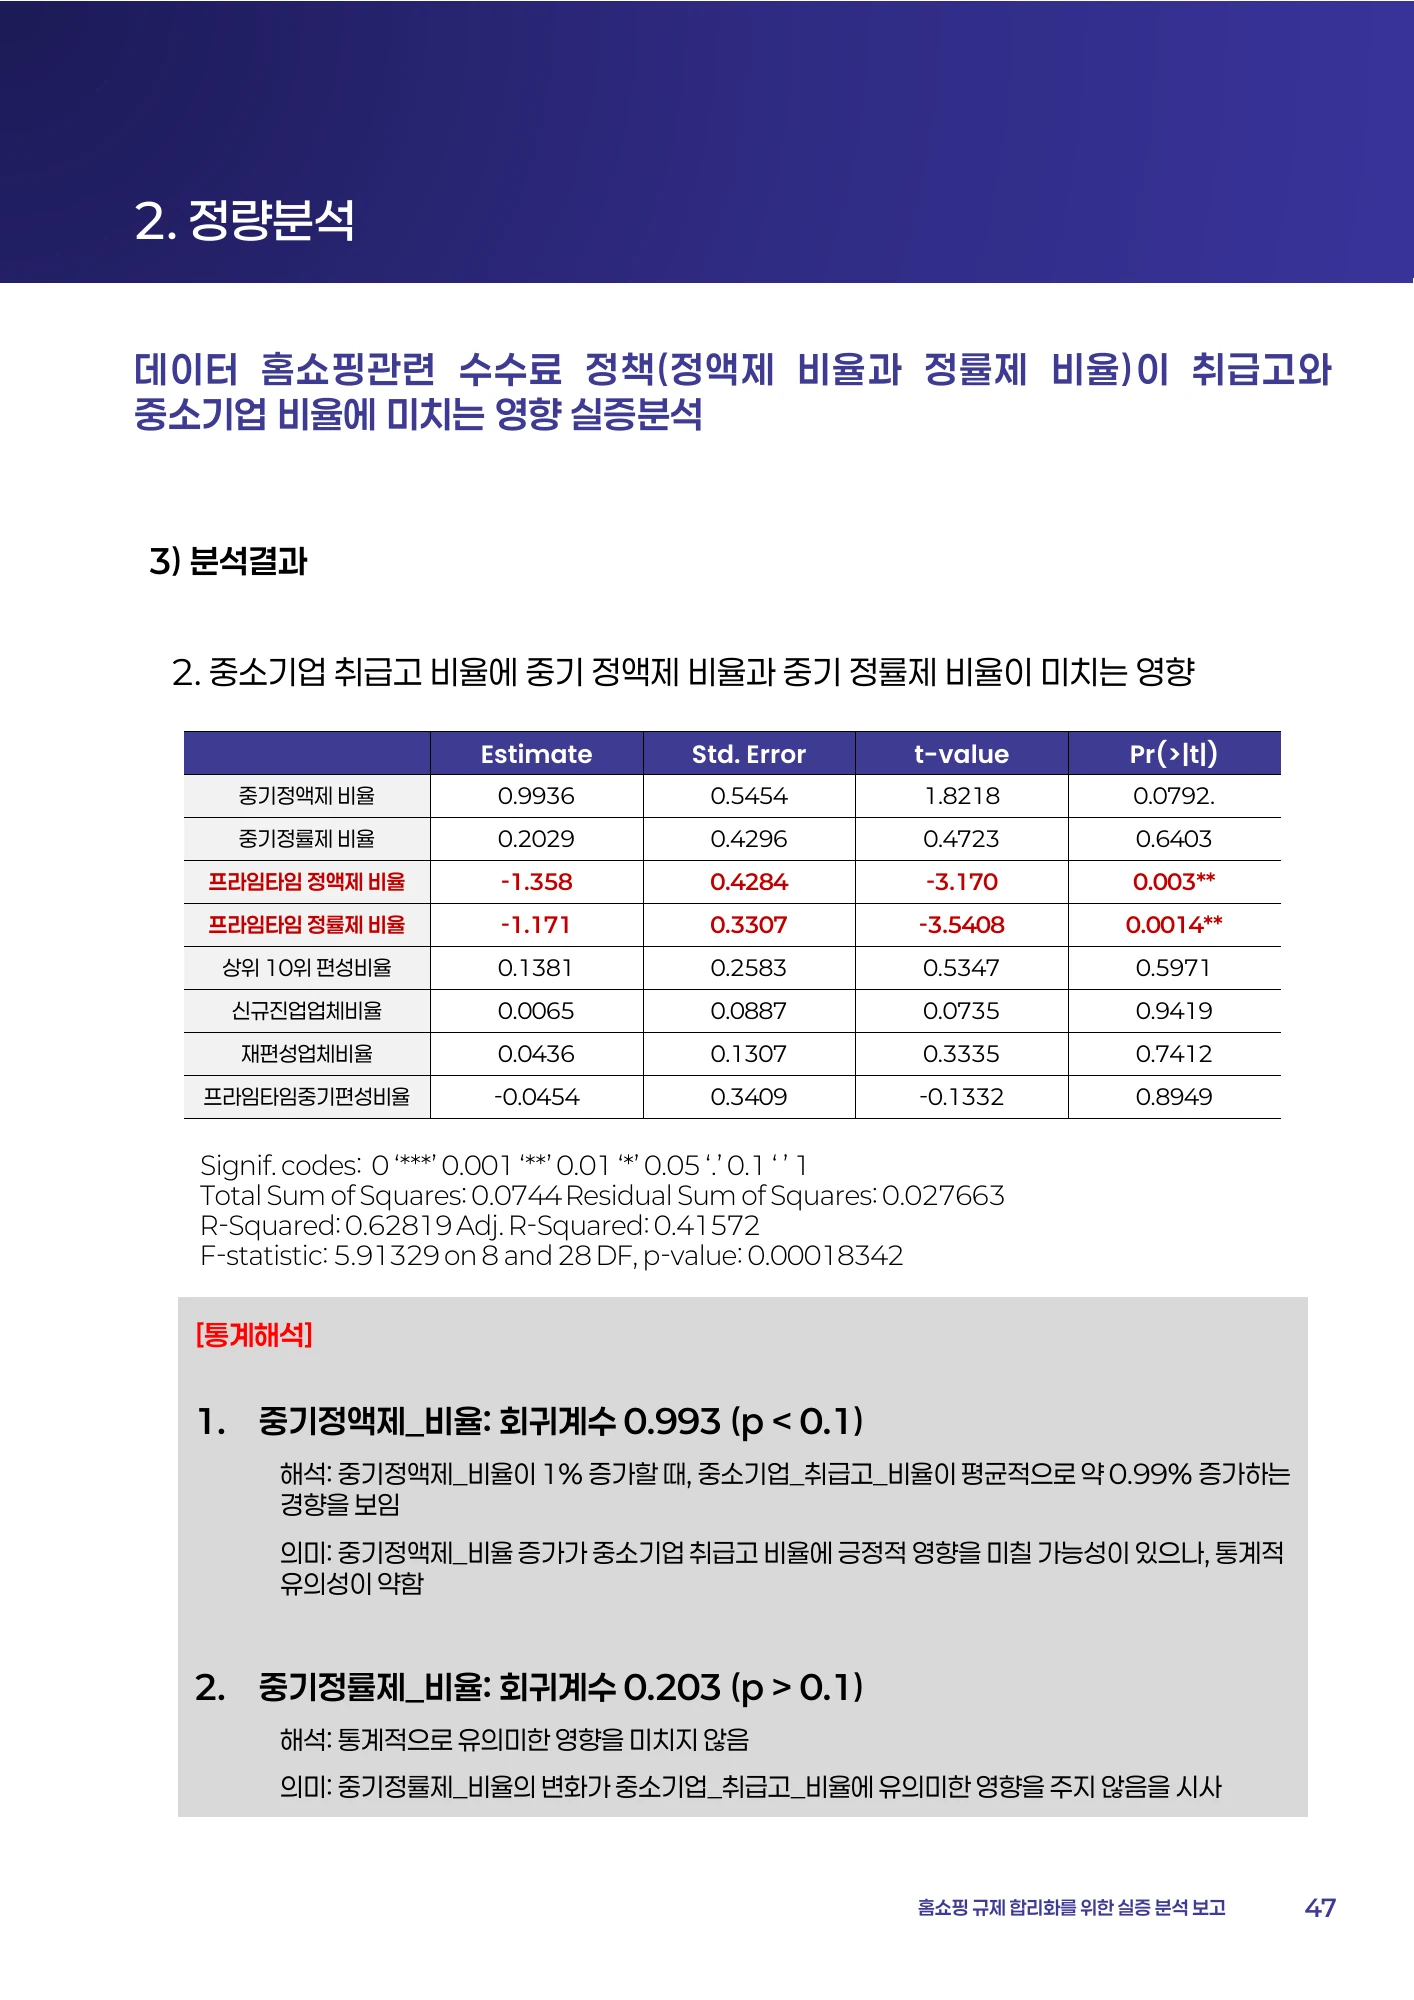
45쪽의 로그 취급고 모형에서 전체 중기 정액제 비율은 계수 .8106, p=.569로 유의하지 않습니다. 프라임 정률제 비율은 −3.008, p=.001입니다. 반면 47쪽 중기 취급고 비율 모형은 전체 정액제 .9936, p=.0792, 프라임 정액제 −1.358, p=.003, 프라임 정률제 −1.171, p=.0014를 제시합니다. 서로 다른 결과지표와 시간대를 섞어 하나의 수수료 인상 효과로 표현하지 않습니다.
In page 45’s log-transaction model, overall SME flat-fee share is .8106 (p=.569), while prime-time percentage-fee share is −3.008 (p=.001). Page 47’s SME-share model reports overall flat fees .9936 (p=.0792), prime-time flat fees −1.358 (p=.003) and prime-time percentage fees −1.171 (p=.0014). Different outcomes and scheduling windows cannot be merged into one fee effect.
같은 사업자의 시간에 따른 변화를 이용하는 고정효과 모형은 변하지 않는 특성 일부를 통제하지만, 판매 실적이 좋은 업체에 시간과 수수료 조건을 달리 배정하는 역방향 관계까지 자동 제거하지는 않습니다. 입력 비율이 0~1인지 0~100인지도 원자료로 확인하지 않았으므로 계수를 곧바로 ‘1%포인트 변화의 효과’로 번역하지 않습니다.
Fixed effects use within-operator variation to control some stable characteristics, but do not automatically remove reverse allocation of airtime or fee terms to better-performing suppliers. Without verifying whether inputs are scaled 0–1 or 0–100, coefficients should not be translated directly into effects of one percentage point.
PDF 파일 44, 45, 47, 48쪽PDF pages 44, 45, 47, 48
모의실험의 가정과 설문 표본의 정합성Simulation assumptions and survey consistency
생방송 모형은 3시간 대비 증가분을 21시간으로 나누어 T커머스 성장률에 .05, 이익률에 .01을 더하고 홈쇼핑 성장률에는 .01, 이익률에는 .005를 빼도록 정합니다. 따라서 24시간 결과는 이 반응 가정 아래의 계산입니다. 41쪽은 이익 금액이 매출보다 크게 적힌 단위 문제도 있어, 해당 금액을 확정 정책 편익으로 재사용하지 않습니다.
The live-hour model divides expansion above three hours by 21, adding .05 to T-commerce growth and .01 to margin, while subtracting .01 and .005 for home shopping. The 24-hour result is conditional on those rules. Page 41 also prints profit amounts exceeding revenue, indicating a unit problem; those amounts should not be reused as established benefits.
정성조사 개요는 2024년 9월 1~20일 오프라인 조사로 설명하지만, 결과 쪽의 총 120명과 서술한 집단 수 60+20+20+10=110명은 일치하지 않습니다. 표의 전문가 수도 산업군 표에서는 20, 직원수 표에서는 25로 다릅니다. 의견의 다양성은 살피되, 이 수치를 확인하지 않은 상태에서 전체 찬반 비율이나 대표성 높은 설문 결론을 새로 계산하지 않습니다.
The qualitative section describes an offline survey on September 1–20, 2024. Its stated total of 120 differs from the listed groups summing to 110; expert counts also differ between tables (20 versus 25). Views can inform issues, but unresolved counts do not support newly calculated overall approval rates or representative conclusions.
PDF 파일 40, 41, 59, 60쪽PDF pages 40, 41, 59, 60
핵심 결과를 표로 읽기Read the key results in tables
| 종속변수Outcome | 설명변수Predictor | 계수Coefficient | p |
|---|---|---|---|
| 전체 신규 업체 수All new suppliers | 전체 중기 편성 비율Overall SME programming share | 0.257 | 0.265 |
| 전체 신규 업체 수All new suppliers | 프라임 중기 편성 비율Prime-time SME programming share | −6.311 | 8.17E−07 |
| 신규 중소업체 수New SME suppliers | 전체 중기 편성 비율Overall SME programming share | 0.407 | 0.010 |
| 신규 중소업체 수New SME suppliers | 프라임 중기 편성 비율Prime-time SME programming share | −5.589 | 0.000 |
| 상위 5% 중소업체 편성시간Leading 5% of SME suppliers’ airtime | 전체 중기 편성 비율Overall SME programming share | 80.518 | 0.008 |
29·31·51쪽의 서로 다른 모형에서 발췌했다. 원문 단위를 유지했으며 비율 입력의 1단위가 1%포인트인지는 별도 확인이 필요하다. p=0.000은 원문의 반올림 표기다. 인과 효과로 해석하지 않는다.Selected from different models on pages 29, 31 and 51. Coefficients retain source units; whether one input unit equals a percentage point requires verification. p=.000 is printed rounding. These are not identified causal effects.
이 표를 읽는 방법How to read this table
첫 두 행은 전체 신규 업체 수, 다음 두 행은 신규 중소업체 수를 설명합니다. 전체 편성 계수 .257의 p=.265와 신규 중기 계수 .407의 p=.010은 다른 결과입니다. ‘전체 편성은 아무 효과가 없다’거나 ‘모든 신규 진입을 늘렸다’는 식으로 통합하면 결과 차이를 지우게 됩니다.The first rows concern all new suppliers, while later rows concern new SMEs. Overall programming .257 (p=.265) and .407 (p=.010) refer to different outcomes. Neither “no effect on entry” nor “increased all entry” accurately summarises both.
상위 5% 업체 편성시간 80.518은 업체 수가 아니라 시간의 회귀계수입니다. 다른 행의 신규 업체 계수와 크기 순위를 비교할 수 없습니다. p=.000은 표시 자릿수 반올림이며 확률이 정확히 0이라는 뜻이 아닙니다. 유의성도 인과적 식별과는 별개입니다.The 80.518 estimate concerns leading suppliers’ airtime, not supplier counts, and cannot be ranked by magnitude against entry coefficients. Printed p=.000 is rounding, not exactly zero probability. Statistical significance is also distinct from causal identification.
PDF 파일 29, 31, 51쪽PDF pages 29, 31, 51
원문 회귀표의 선택 행 재구성Selected rows reconstructed from the source regression tables · PDF 파일 29, 31, 51쪽PDF pages 29, 31, 51
| 자료 유형Evidence | 설명 가능한 범위Interpretation | 주요 확인점Check needed |
|---|---|---|
| 패널 회귀Panel regression | 사업자·시점 지표 사이의 조건부 관계Conditional associations across operators and time | 변수 스케일·동시 변화·모형 차이Scales, simultaneous changes and specifications |
| 모의실험Simulation | 가정한 반응식 아래의 계산 결과Calculations under assumed response rules | 금액 단위와 입력 가정Currency units and assumptions |
| 설문·FGISurvey and qualitative accounts | 응답자의 인식과 이해 차이Respondents’ perceptions and differing interests | 본문·표의 응답자 수 충돌Conflicting respondent counts |
문서의 분석을 비교해 재구성한 안내표다. 모의실험·발언을 관측된 시장 효과로 대체하지 않는다.An interpretive guide to the report’s evidence. Simulation outputs and quotations do not replace observed market impacts.
이 표를 읽는 방법How to read this table
패널 회귀는 관측한 지표 사이의 조건부 관계, 시뮬레이션은 입력한 반응식의 계산, 인터뷰는 당사자의 경험과 의견입니다. 세 가지가 같은 방향을 말하더라도 서로 독립적으로 정책 효과를 검증한 실험 세 개로 합산할 수 없습니다.Panel regressions estimate conditional observed relationships; simulations apply specified rules; interviews provide experiences and opinions. Agreement does not turn them into three independent experiments verifying a policy effect.
결론의 단계적 생방송 확대·수수료 유연화·옴니채널·우수 중기 발굴은 이 근거들을 종합한 제안입니다. 효과 확인에는 도입 뒤 신규 업체의 생존·반복 편성·매출과 소비자 보호 지표를 함께 추적하는 후속 평가가 필요합니다.Phased live expansion, flexible fees, omnichannel delivery and supplier development are proposals synthesised from this evidence. Subsequent evaluation would need supplier survival, repeat scheduling, sales and consumer-protection indicators.
PDF 파일 35, 40, 59, 60, 73쪽PDF pages 35, 40, 59, 60, 73
분석 방법과 한계 비교Comparison of methods and limitations · PDF 파일 27, 35, 40, 53, 59, 60쪽PDF pages 27, 35, 40, 53, 59, 60
원문의 핵심 표·그래프Key tables & figures in the source
표·그림이 수록된 원문 페이지입니다. 이미지를 누르면 확대할 수 있습니다.Original pages containing the selected tables or figures. Select an image to enlarge it.
전체 신규 납품업체 수 모형Model for all new suppliers
전체 취급고에 대한 수수료 모형Fee model for overall transaction value
중소기업 취급고 비율에 대한 수수료 모형Fee model for the SME transaction share
상위 중소업체 편성시간 모형Leading SME suppliers’ airtime model
설문 표본 설명과 분포Survey sample description and distributions
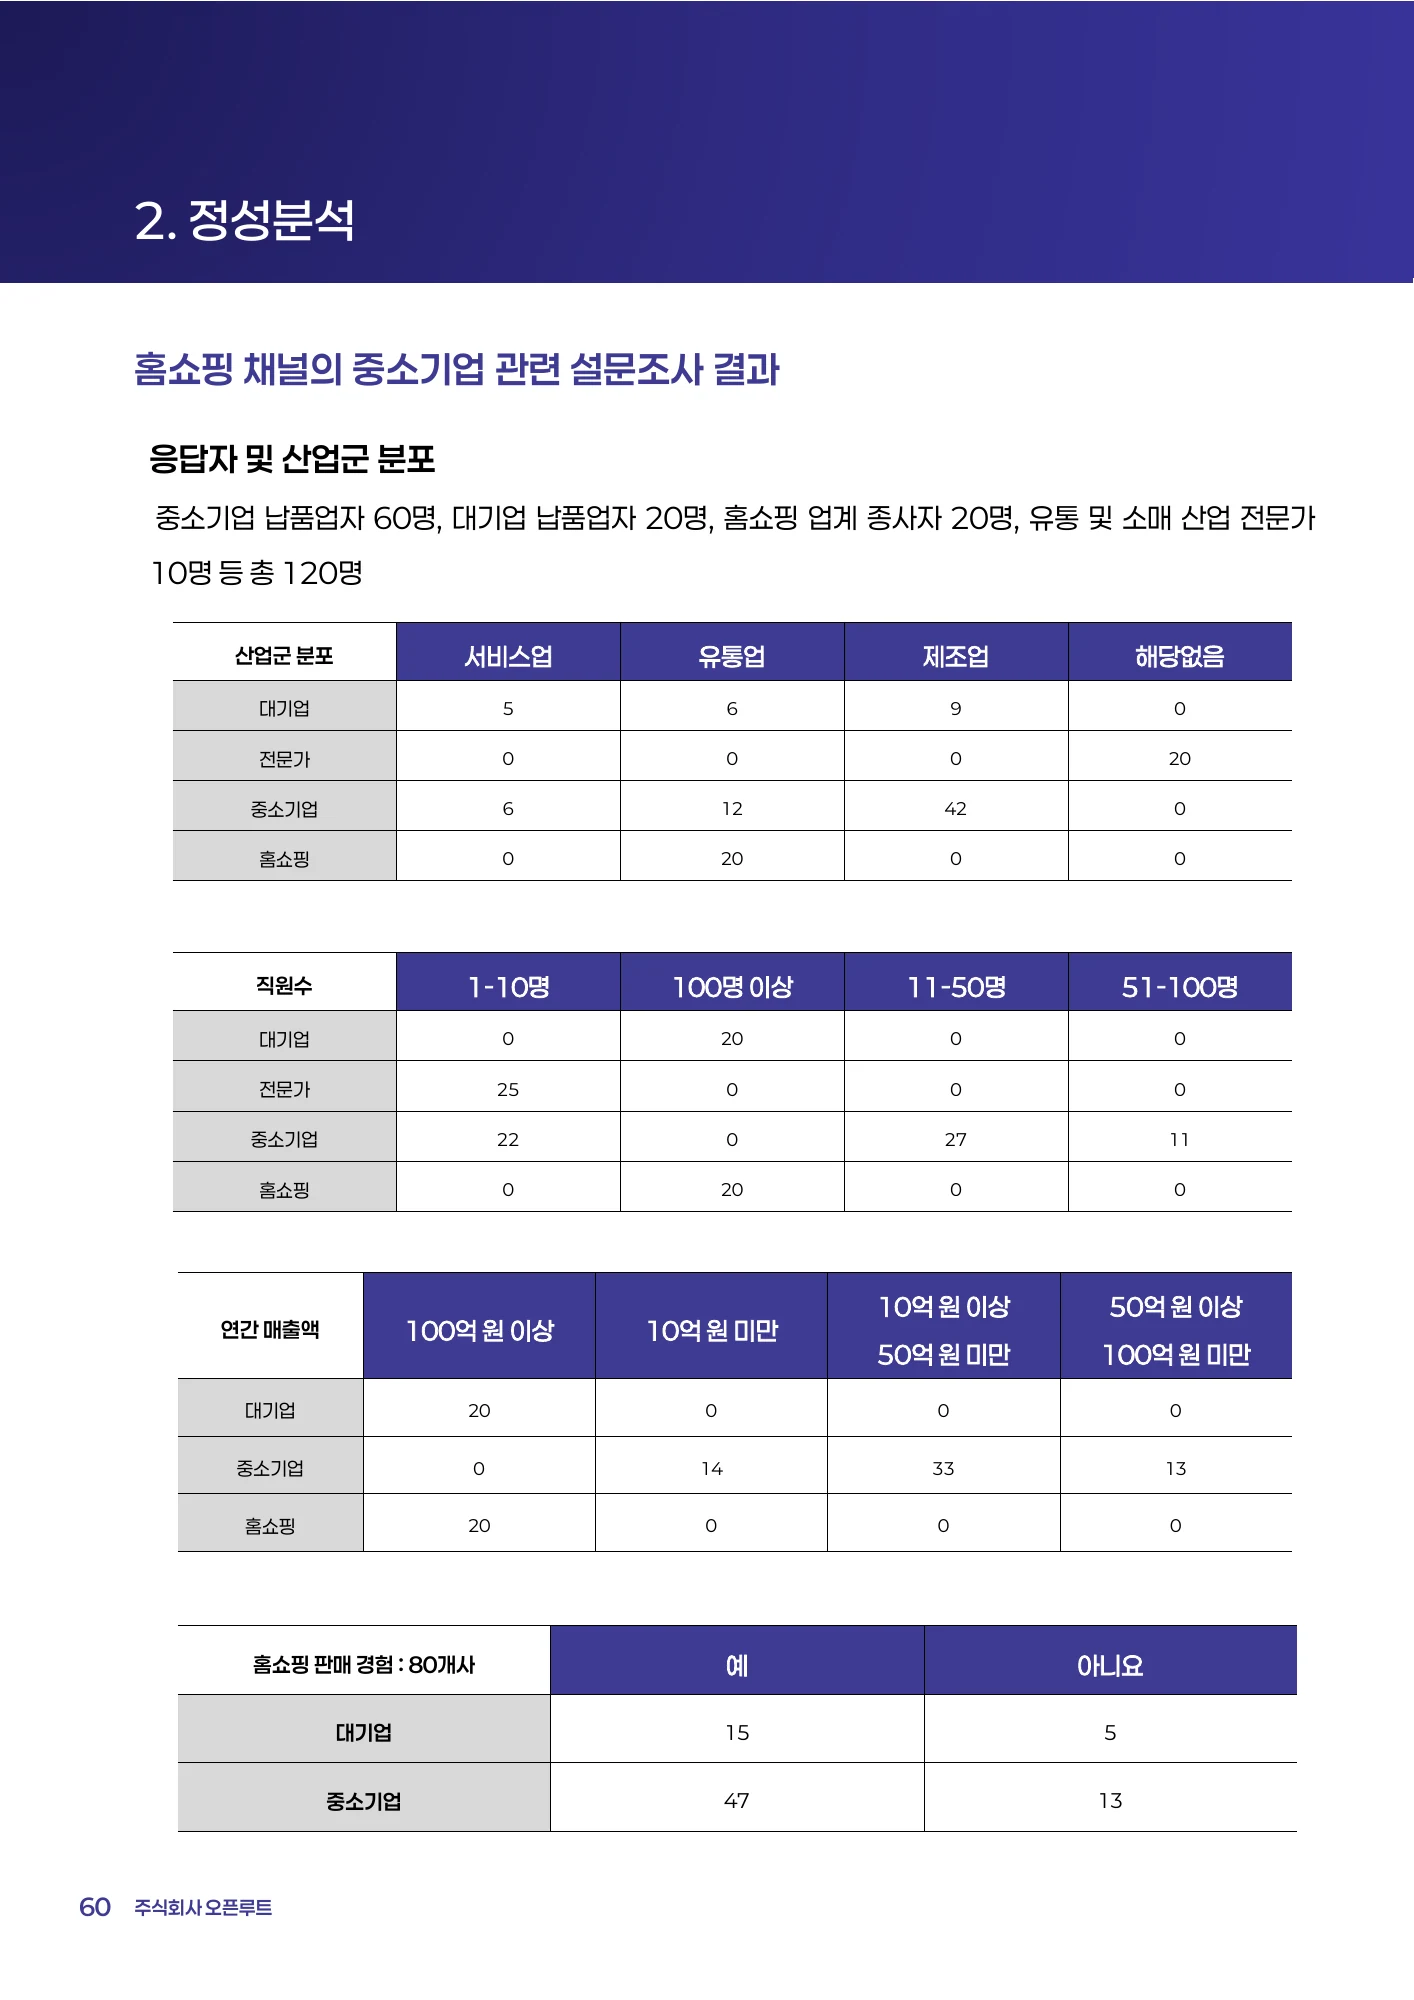
수치·단위·조사 설명의 충돌Conflicts in numbers, units and survey descriptions
활용 한계는 관측 자료의 인과 해석뿐 아니라 문서 내부의 일관성에도 있다. 비율 변수의 스케일, 모의실험의 금액 단위, 53쪽 변수명과 해석, 설문의 집단별 인원이 서로 맞는지 원자료·코드와 대조해야 한다. p=0.000은 확률이 실제 0이라는 의미가 아니라 반올림 표기다. 이 해설은 확인 가능한 회귀표 일부를 정확히 재구성하고 충돌이 있는 수치를 제외했지만, 원문 전체의 계산을 재현하거나 오류를 모두 수정한 것은 아니다. 정책 방향에 대한 원문의 주장과 검증된 효과의 범위는 계속 구분해야 한다.
Limitations include internal consistency as well as causal interpretation. Variable scales, simulation currency units, the page-53 label and interpretation, and survey subgroup counts require the underlying data and code. A printed p=.000 is rounding, not a literal zero probability. This account faithfully reconstructs selected regression entries and excludes conflicted claims; it does not reproduce every calculation or certify the document as error-free. Recommendations remain distinct from verified impacts.
PDF 파일 29, 31, 40, 41, 53, 59, 60, 61, 73쪽PDF pages 29, 31, 40, 41, 53, 59, 60, 61, 73
근거 쪽: Evidence pages: 2, 3, 16, 27, 28, 29, 30, 31, 32, 33, 35, 36, 37, 38, 40, 41, 44, 45, 46, 47, 48, 50, 51, 52, 53, 55, 58, 59, 60, 61, 62, 63, 65, 69, 70, 71, 72, 73, 74 · PDF 파일 기준, 인쇄 쪽수와 다를 수 있습니다. · PDF file pagination may differ from printed page numbers.
근거와 검토 범위Source and review scope
74쪽의 제공된 원문 자료를 기준으로 본문·표·선정 이미지를 확인했습니다. 해설은 연구 내용을 새 문장으로 정리했으며, 실제 원문 페이지를 함께 실었습니다. 분석 결과의 독립 재현이나 기관의 공식 입장 확인을 뜻하지 않습니다.
The text, tables and selected images were checked against the 74-page source document supplied for this site. This guide is an editorial summary accompanied by original source pages. This does not imply independent replication or institutional endorsement.
확인한 PDF 쪽: Source PDF pages: 1, 2, 3, 16, 27, 28, 29, 30, 31, 32, 33, 35, 36, 37, 38, 40, 41, 44, 45, 46, 47, 48, 50, 51, 52, 53, 55, 58, 59, 60, 61, 62, 63, 65, 69, 70, 71, 72, 73, 74