미디어 기업의 효율성 분석: DEA와 맘퀴스트 지수의 적용The efficiency analysis of media companies: An application of DEA and Malmquist indices
원문 제목: The efficiency analysis of media companies: An application of DEA and Malmquist indices
번역 제목은 이 사이트의 편집 번역입니다. 서지와 인용에는 원문 제목을 사용합니다.Translated titles are editorial translations for this site. Bibliographic records and citations retain the original title.
저자 표시: Author notes: 굵은 글씨: 김용희Bold: Yonghee Kim 교신저자Corresponding author
Telecommunications Policy, 48(4), 논문 번호 102737Article 102737색인: Indexed in: SSCI
요약Summary
2019~2022년 국내외 콘텐츠 제공 기업 25곳의 자원 활용과 생산성 변화를 DEA와 Malmquist 지수로 비교했다. 생산성 변화를 기술 변화, 순수 효율성 변화, 규모 효율성 변화로 나누어 기업마다 다른 개선 경로를 확인했다.
DEA and Malmquist indices compare resource use and productivity change among 25 local and global content providers over 2019–2022. Decomposing productivity into technological, pure-efficiency, and scale-efficiency changes reveals different paths across firms.
한눈에 보기At a glance
- 자료 기간Data period
- 2019 – 2022
- 표본 크기Sample size
- N = 25
- 방법Methods
- Data Envelopment Analysis
- Malmquist Productivity Index
- Efficiency Decomposition
- 키워드Keywords
- Media Efficiency
- DEA
- Malmquist Index
- Productivity Analysis
- Broadcasting Companies
- Performance Measurement
- Technical Efficiency
원문을 바탕으로 연구의 논리와 결과를 풀어쓴 해설입니다. 수치는 표시한 표와 쪽을 기준으로 읽습니다. 아래 표는 핵심 항목을 웹에서 읽도록 재구성했고, 원문 표·그림이 있는 페이지를 함께 제공합니다.This reading guide explains the paper’s reasoning and findings in new wording. Tables below re-present selected source results for web reading, alongside images of the relevant original pages.
생산성이 좋아진 이유는 기술인가, 운영인가, 규모인가Is productivity change driven by technology, operations or scale?
콘텐츠 기업의 생산성이 좋아졌다는 말에는 여러 뜻이 섞여 있습니다. 같은 자원으로 더 많은 성과를 내는 운영 개선일 수도 있고, 산업 전체의 기술적 가능성이 바뀐 결과일 수도 있으며, 사업 규모가 더 알맞아졌기 때문일 수도 있습니다. 이 논문은 팬데믹 전후 미디어 기업을 비교하면서 그 경로를 분리해 설명합니다.
An improvement in productivity can have several meanings: a firm may use its resources better, the industry’s feasible production frontier may shift, or the firm may move toward a more suitable scale. This paper compares media companies around the pandemic and decomposes productivity change into these distinct components.
PDF 파일 1, 2, 3쪽PDF pages 1, 2, 3
국내외 콘텐츠 제공 기업 25곳의 재무자료Financial data for 25 content providers
2019~2022년 국내외 주요 콘텐츠 제공 기업 25곳이 대상이며 Statista와 S&P Global 등의 재무자료를 사용했습니다. 투입은 총자산·총비용·노동, 산출은 총매출과 EBITDA 관련 지표입니다. 국가와 기업 유형이 다른 사업자들을 선택한 재무 지표 체계 안에서 상대 비교합니다.
The sample comprises 25 prominent local and global content providers over 2019–2022, using financial sources including Statista and S&P Global. Inputs are assets, expenses and labor; outputs concern revenue and EBITDA. Firms from different countries and business models are compared within this selected financial measurement framework.
따라서 여기서의 효율성은 콘텐츠의 예술적 가치·다양성·공적 기여를 모두 포괄하는 평가가 아닙니다. 투입과 산출의 정의를 바꾸거나 비교 기업을 추가하면 경계와 상대적 위치도 달라질 수 있습니다. 재무 생산성의 특정 측면을 보는 지표라는 점이 중요합니다.
Efficiency here is not a comprehensive rating of creative quality, diversity or public value. Changing inputs, outputs or the comparison group can alter the estimated frontier and relative positions. The measures describe particular dimensions of financial productivity rather than the overall social worth of a media organization.
PDF 파일 3, 4쪽PDF pages 3, 4
효율적 기업의 경계와 그 경계의 이동The frontier and how it moves
DEA는 여러 투입과 산출을 함께 놓고 표본 안에서 상대적으로 앞선 기업들을 연결해 비교 경계를 만듭니다. 산출지향 접근은 주어진 투입으로 성과를 얼마나 더 낼 여지가 있는지 묻습니다. 규모수익 가정을 달리해 운영 효율성과 규모의 적합성도 구분합니다.
DEA constructs a relative frontier from efficient combinations of multiple inputs and outputs within the sample. An output-oriented approach asks how much output could expand with given resources. Different returns-to-scale assumptions help distinguish operational performance from whether the organization is operating at a suitable scale.
Malmquist 지수는 시점 간 생산성 변화를 기술변화, 순수 효율성 변화, 규모 효율성 변화로 나눕니다. 지수 1은 기준 대비 변화 없음, 1보다 크면 개선, 작으면 악화를 뜻합니다. 다만 각 구성요소를 구분하는 것과 그 변화의 외부 원인을 인과적으로 알아내는 일은 다릅니다.
The Malmquist index decomposes changes over time into technological, pure-efficiency and scale-efficiency components. One denotes no change; values above and below one indicate improvement and decline. Decomposition identifies where a change appears in the accounting framework, not the causal external event responsible for it.
PDF 파일 3, 4, 5쪽PDF pages 3, 4, 5
비슷한 총변화도 서로 다른 경로에서 발생Similar totals can conceal different pathways
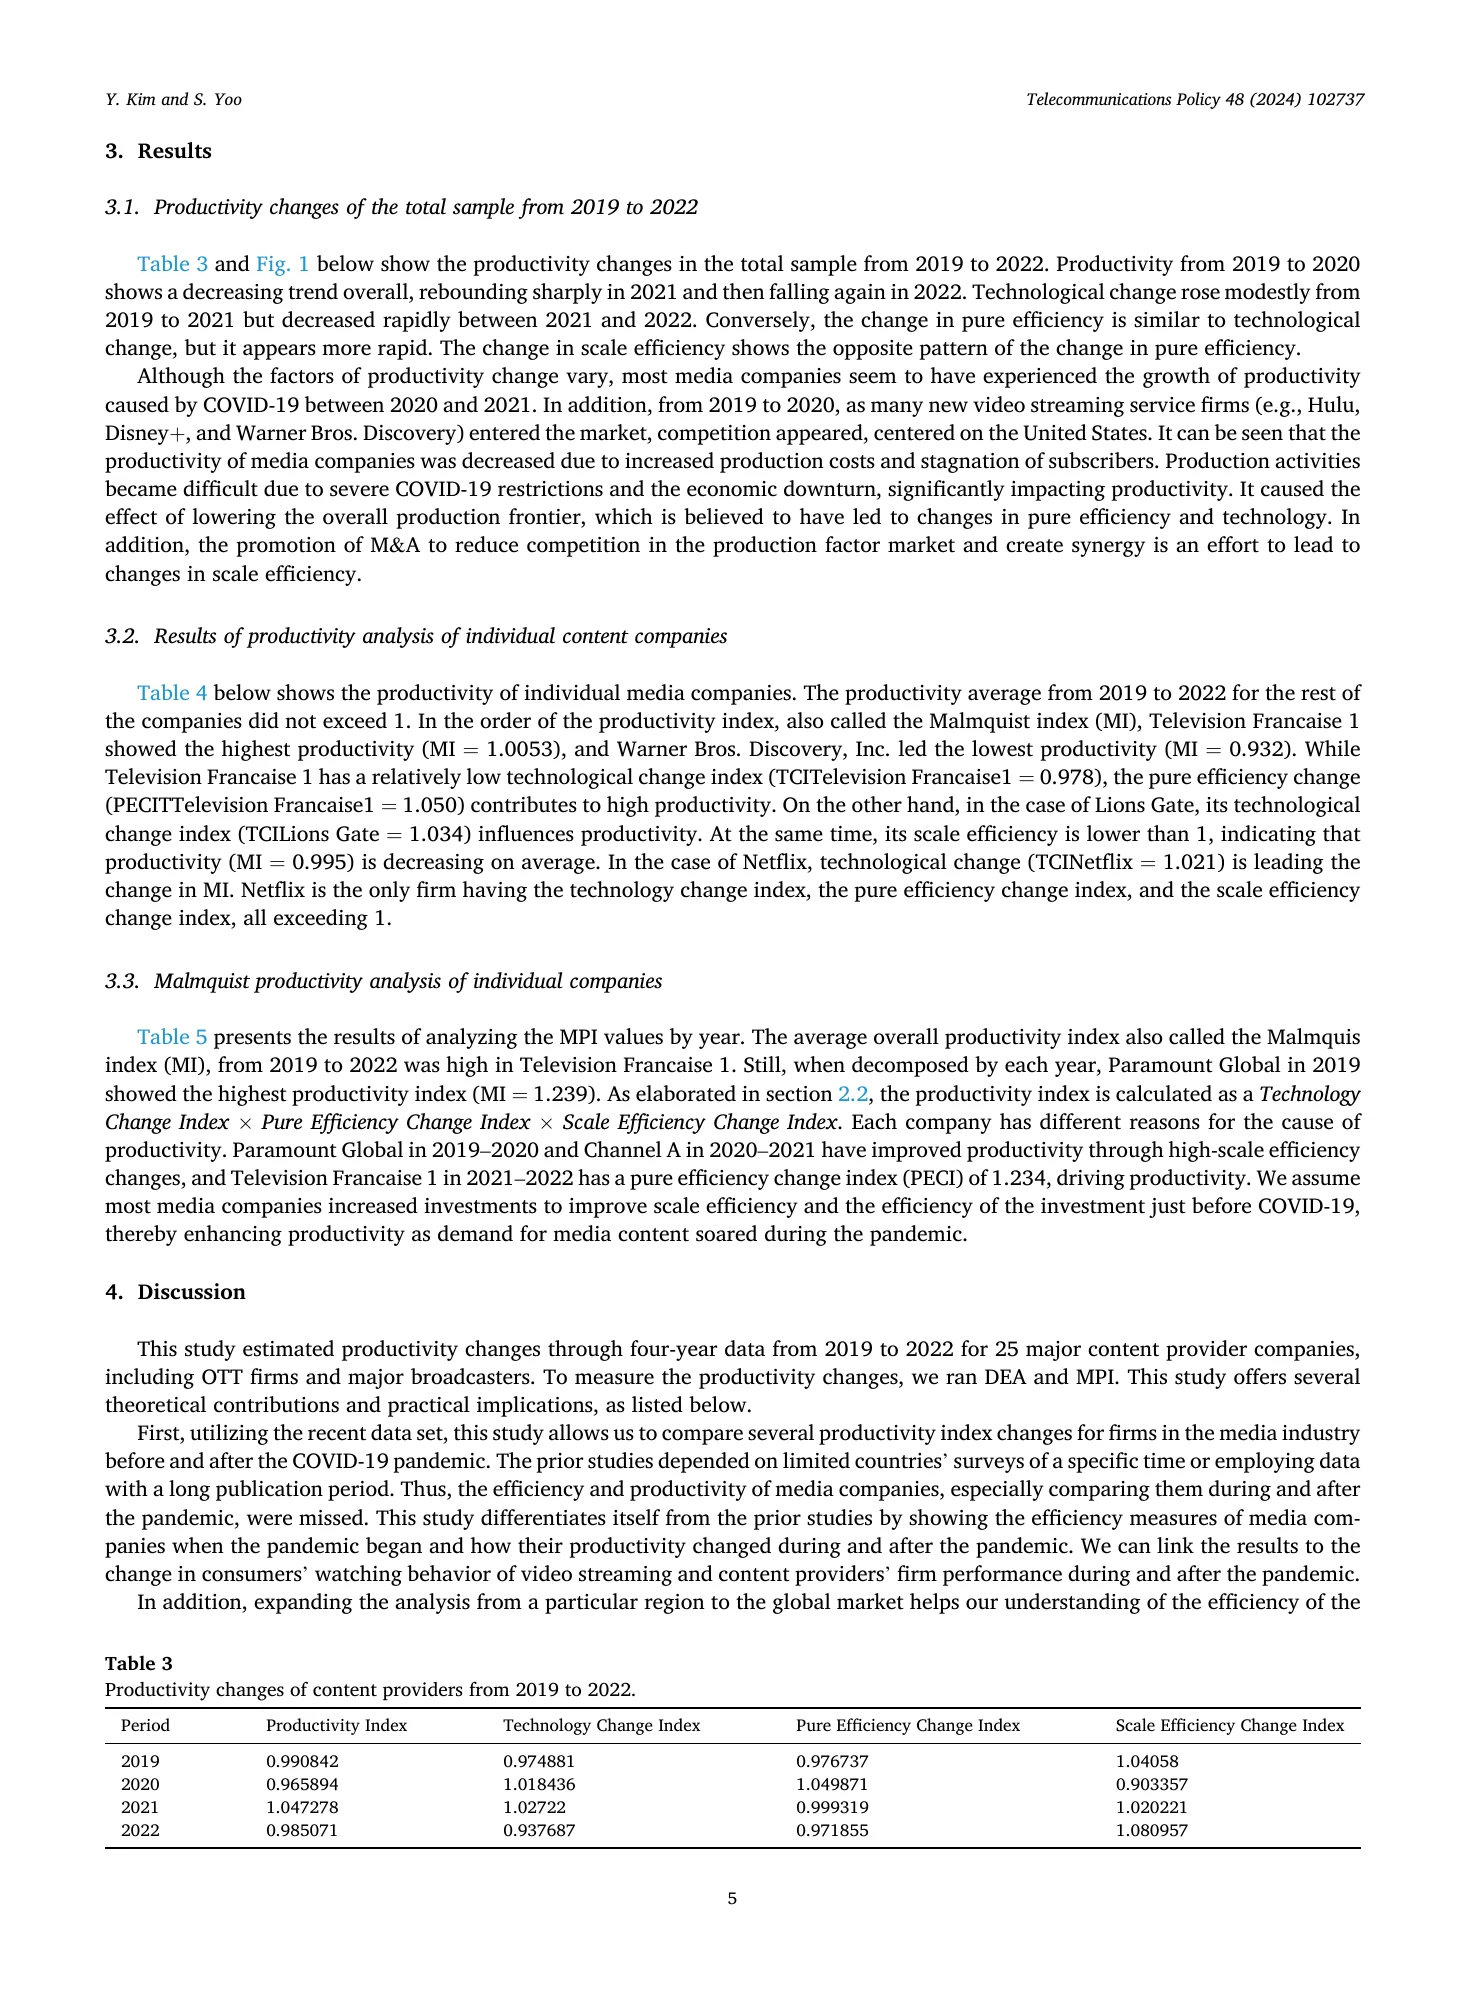
표 3의 전체 생산성 지수는 2020년 0.965894, 2021년 1.047278, 2022년 0.985071로 보고됩니다. 마지막 해에는 기술변화 0.937687과 규모 효율성 변화 1.080957이 반대 방향을 보입니다. 규모 조정이 있어도 기술적 경계의 하락을 완전히 상쇄하지 못할 수 있다는 읽기가 가능합니다.
Table 3 reports aggregate productivity indices of 0.965894 in 2020, 1.047278 in 2021 and 0.985071 in 2022. In the last year, technological change is 0.937687 while scale-efficiency change is 1.080957. Scale adjustment and frontier movement can therefore point in different directions.
기업별 표 4에서 TF1의 생산성 지수는 1.053, SBS는 1.042, Netflix는 1.021, Warner Bros. Discovery는 0.932입니다. 이 값은 현재의 기업 순위가 아니라 해당 자료와 산식의 변화지수입니다. TF1은 순수 효율성 변화, 일부 다른 사업자는 기술 또는 규모 요소의 기여가 상대적으로 두드러집니다.
Table 4 reports productivity indices of 1.053 for TF1, 1.042 for SBS, 1.021 for Netflix and 0.932 for Warner Bros. Discovery. These are historical change indices, not current corporate rankings. The decomposition highlights pure-efficiency contributions for TF1 and different technology or scale patterns for other firms.
PDF 파일 5, 6, 7, 8쪽PDF pages 5, 6, 7, 8
핵심 결과를 표로 읽기Read the key results in tables
| 기업Firm | 생산성Productivity | 기술변화Technology | 순수 효율성Pure efficiency | 규모 효율성Scale efficiency |
|---|---|---|---|---|
| Television Francaise 1 | 1.053 | 0.978 | 1.050 | 1.025 |
| Seoul Broadcasting System | 1.042 | 0.981 | 1.056 | 1.005 |
| Netflix | 1.021 | 1.021 | 1.000 | 1.000 |
| Warner Bros. Discovery | 0.932 | 0.994 | 1.003 | 0.934 |
원문 표 4의 선택 기업. 1이 변화 없음입니다. TF1 본문 1.0053과 충돌하므로 표에 인쇄된 1.053을 사용합니다.Selected firms from Table 4; one denotes no change. TF1 is shown as the printed table value 1.053, which conflicts with 1.0053 in the prose.
원문 표 4 발췌Selected rows from original Table 4 · PDF 파일 6쪽PDF page 6
원문의 핵심 표·그래프Key tables & figures in the source
표·그림이 수록된 원문 페이지입니다. 이미지를 누르면 확대할 수 있습니다.Original pages containing the selected tables or figures. Select an image to enlarge it.
생산성 변화와 기업별 구성Productivity change and firm components
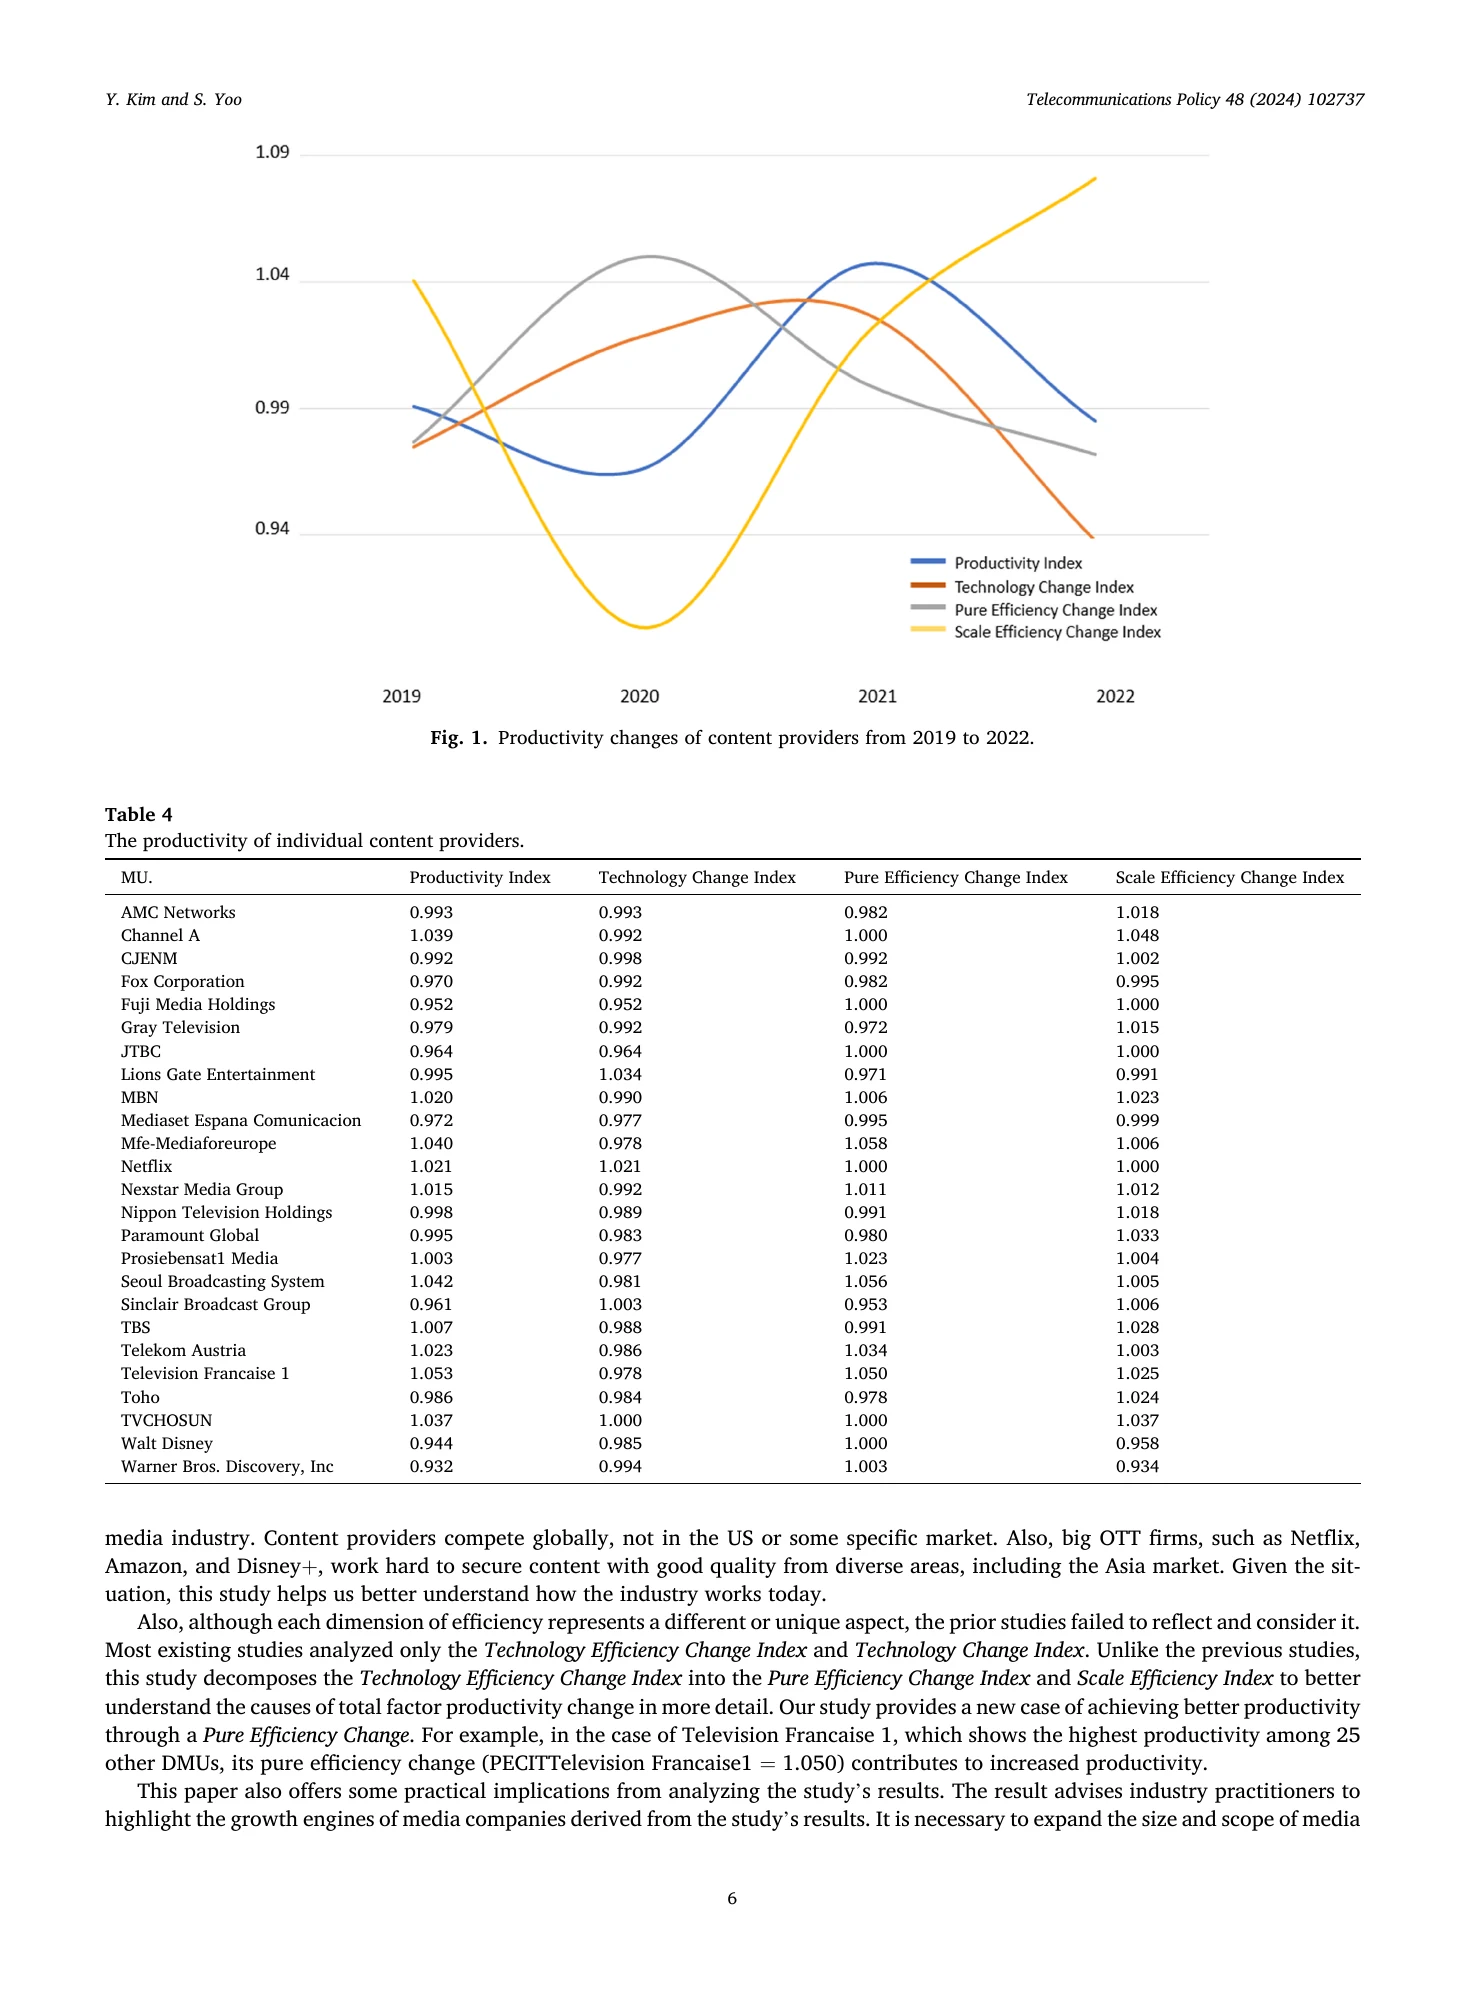
연도별 생산성 구성요소Annual productivity decomposition
모든 기업에 같은 성장 전략을 권하지 않기Avoid one growth prescription for every firm
저자는 해외 진출과 규모 확대가 도움이 될 수 있지만 모든 회사에 같은 방식으로 적용되지는 않는다고 논의합니다. 효율성 개선 계획은 기술 도입, 기존 운영 개선, 규모 조정 중 무엇이 필요한지 구분해야 한다는 시사점입니다. 특정 인수합병이 생산성을 높였다는 인과 검증으로 확대할 수는 없습니다.
The discussion considers international expansion and scale growth but explicitly rejects one strategy for every firm. A productivity diagnosis should distinguish technology adoption, better operations and scale adjustment. The estimates do not establish that a particular merger or foreign-market entry caused the observed improvement.
PDF 파일 6, 8쪽PDF pages 6, 8
원인 진단과 상대 비교의 경계Limits of causal diagnosis and relative benchmarking
표본 25곳과 4개 연도에 한정되며 회계·사업모델 차이와 DEA의 지표 선택에 영향을 받습니다. 저자도 외부 요인을 포함한 2단계 원인 분석이 더 필요하다고 밝힙니다. 본문 TF1 수치 1.0053과 표 4의 1.053이 달라 이 해설과 비교표는 명시적으로 표 4를 기준으로 했습니다.
The analysis is limited to 25 firms and four years and depends on financial comparability and DEA specification. The authors call for further second-stage analysis of external determinants. The prose gives TF1 as 1.0053 whereas Table 4 gives 1.053; the comparison here explicitly follows Table 4 rather than silently reconciling that discrepancy.
PDF 파일 5, 6, 8쪽PDF pages 5, 6, 8
근거 쪽: Evidence pages: 1, 2, 3, 4, 5, 6, 7, 8 · PDF 파일 기준, 인쇄 쪽수와 다를 수 있습니다. · PDF file pagination may differ from printed page numbers. 원문 출처 ↗Source ↗
원문 이미지 보기 · 1장View original document images · 1
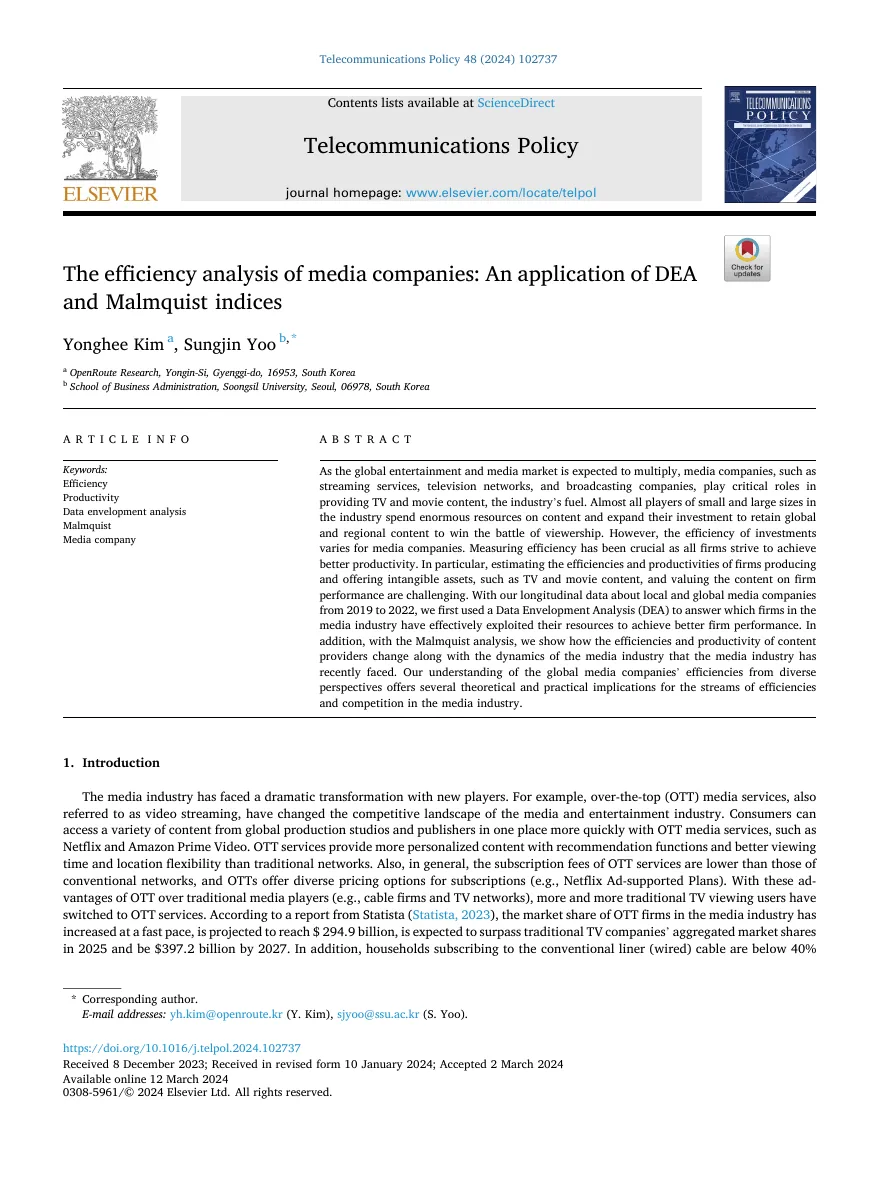
서지 정보Bibliographic information
- 학술지Journal
- Telecommunications Policy
- 권(호)Volume (issue)
- 48(4)
- 논문 번호Article number
- 102737
- 게재Published
- 2024
- 색인Indexing
-
- SSCI (저자 실적 기록 기준)(per the author's records)
- 인용Citations
- Google Scholar 인용 12Cited by 12 (Google Scholar) (새 창) (opens in a new tab) (2026-09-27 기준)(as of 2026-09-27)
인용하기Cite APA · BibTeX
APA
Kim, Y., & Yoo, S. (2024). The efficiency analysis of media companies: An application of DEA and Malmquist indices. Telecommunications Policy, 48(4), Article 102737. https://doi.org/10.1016/j.telpol.2024.102737
BibTeX
@article{kim2024-efficiency,
  author = {Kim, Yonghee and Yoo, Sungjin},
  title = {The efficiency analysis of media companies: An application of {DEA} and Malmquist indices},
  journal = {Telecommunications Policy},
  year = {2024},
  volume = {48},
  number = {4},
  eid = {102737},
  doi = {10.1016/j.telpol.2024.102737}
}