확률적 프런티어 분석을 이용한 포털 서비스 제공자 효율성의 국제 비교International Comparison on Efficiency of Portal Service Providers Using Stochastic Frontier Analysis
원문 제목: International Comparison on Efficiency of Portal Service Providers Using Stochastic Frontier Analysis
번역 제목은 이 사이트의 편집 번역입니다. 서지와 인용에는 원문 제목을 사용합니다.Translated titles are editorial translations for this site. Bibliographic records and citations retain the original title.
International Journal of u-and e-Service, Science and Technology, 8(12), 183–186색인: Indexed in: SCOPUS
요약Summary
포털 서비스 제공 기업 19곳을 확률적 프런티어 분석과 Tobit 회귀로 비교했다. 평균 효율성은 약 70.3%였고, 생산함수의 고정자산 계수는 양으로 유의했다. 효율성과 시장점유율의 관계는 p=0.079로 5% 기준에서 유의하지 않았다.
Stochastic-frontier and Tobit analyses compare 19 portal providers. Mean efficiency is about 70.3%; fixed assets have a positive production-function coefficient, while the market-share association with efficiency is not significant at 5% (p=0.079).
한눈에 보기At a glance
- 표본 크기Sample size
- N = 19
- 방법Methods
- Stochastic Frontier Analysis
- Tobit Regression
- 키워드Keywords
- Portal Services
- Stochastic Frontier Analysis
- Efficiency
- Market Share
- Tobit Regression
- Network Effects
- Internet Services
원문을 바탕으로 연구의 논리와 결과를 풀어쓴 해설입니다. 수치는 표시한 표와 쪽을 기준으로 읽습니다. 아래 표는 핵심 항목을 웹에서 읽도록 재구성했고, 원문 표·그림이 있는 페이지를 함께 제공합니다.This reading guide explains the paper’s reasoning and findings in new wording. Tables below re-present selected source results for web reading, alongside images of the relevant original pages.
포털 사업자의 자원 활용을 국제 비교하면Comparing portal providers’ resource use internationally
검색·정보·소셜 기능을 제공하는 포털은 매출이나 가입자 규모가 크다는 이유만으로 효율적이라고 할 수 있을까요? 이 연구는 노동·고정자산·비용을 사용해 매출을 만드는 상대적 효율성을 비교합니다. 이어 시장점유율·R&D·국제 사업범위가 효율성 점수와 어떤 관계가 있는지 살펴봅니다.
The paper asks whether portal providers’ scale translates into efficient resource use. It compares the revenue generated from labor, fixed assets and costs, then examines associations between efficiency, market share, R&D and international business scope. Size and efficiency are therefore related questions rather than interchangeable performance labels.
PDF 파일 1, 2쪽PDF pages 1, 2
전자상거래 중심 기업을 제외한 19개 사업자Nineteen providers after excluding e-commerce-focused firms
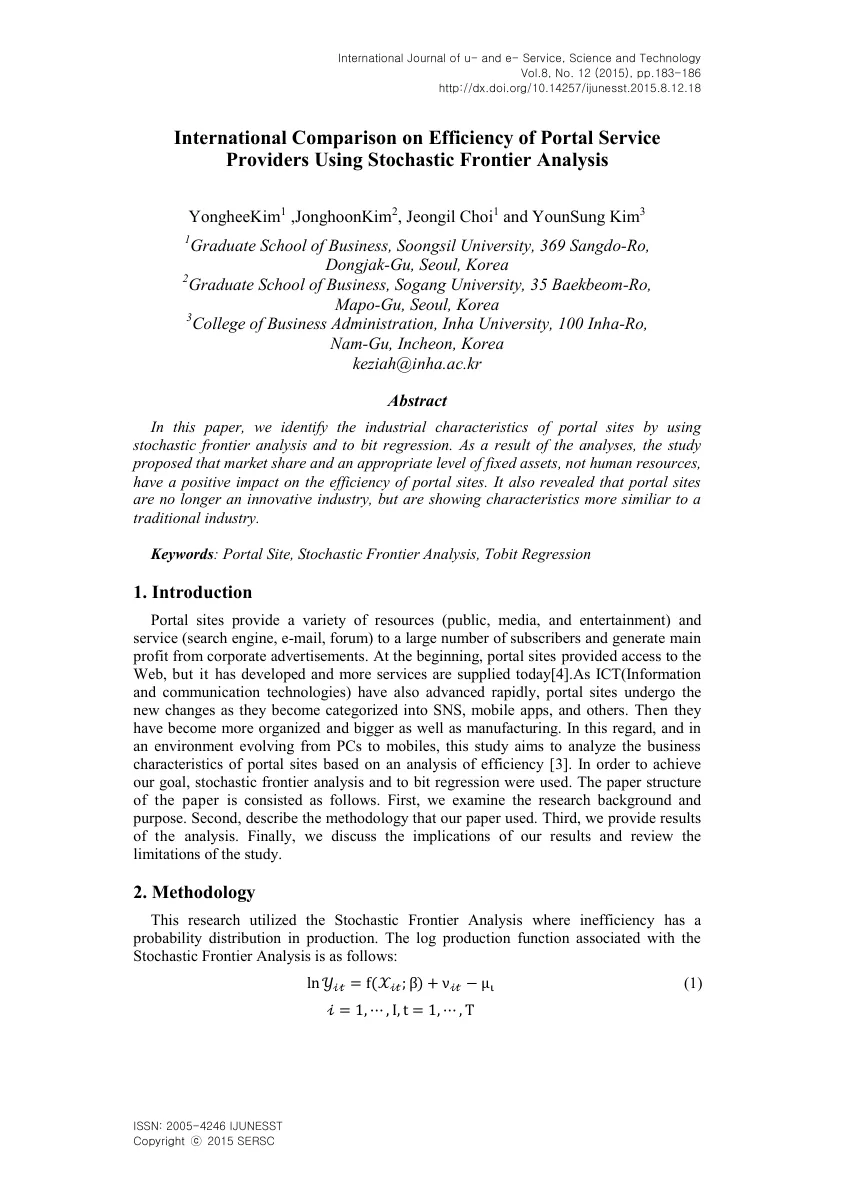
Osiris 데이터베이스의 정보서비스 분류에서 30개 기업을 고른 뒤 전자상거래 중심 11개를 제외한 19개 기업을 비교했습니다. 매출을 산출, 직원 수·유형고정자산·매출원가를 주요 투입으로 사용합니다. 포털의 경계가 명확하지 않다는 문제도 원문에서 인정합니다.
Thirty firms are selected from an information-services classification in Osiris, and 11 e-commerce-focused firms are excluded, leaving 19 providers. Revenue is the output, with employees, tangible fixed assets and cost of goods sold as inputs. The paper acknowledges that the boundaries of portal services are not unambiguous.
다음 단계의 시장점유율은 해당 사업자의 국내 시장 비중이며 사업범위는 국내 0·다국적 1로 코딩했습니다. 표본에는 서로 다른 서비스와 국가의 기업이 섞여 있고 자료연도의 상세 범위가 충분히 명시되지 않아 현재 기업 성과를 나타내는 순위로 사용하지 않습니다.
Market share refers to the provider’s domestic market, while business area is coded zero for domestic and one for multinational sales. Firms differ in services and national environments, and the data’s exact temporal coverage is insufficiently specified. These are historical sample estimates, not present-day corporate rankings.
PDF 파일 2, 3쪽PDF pages 2, 3
잡음과 비효율을 분리하는 생산 경계A frontier separating noise and inefficiency
확률적 프런티어 분석은 관측 매출이 가능한 생산 경계에서 떨어진 정도를 추정하면서 우연한 오차와 비효율을 분리하려는 방법입니다. 로그 형태의 생산함수에 투입을 넣고 효율성 점수를 계산했습니다. 오차 분포와 함수 형태가 결과에 영향을 주는 모수적 접근입니다.
Stochastic frontier analysis estimates how far observed revenue lies below a feasible production frontier while separating random noise from inefficiency. The production function uses logged inputs to construct efficiency scores. This parametric approach depends on functional form and distributional assumptions rather than generating an assumption-free benchmark.
그 점수를 종속변수로 한 Tobit 회귀에서 시장점유율·R&D·사업범위를 비교했습니다. 생산함수의 매출 계수와 두 번째 단계 효율성 계수는 다른 대상이므로 섞어 해석하지 않습니다. R&D가 유의하지 않다는 사실도 혁신투자가 중요하지 않음을 입증하지는 않습니다.
A second-stage Tobit regression compares market share, R&D and business scope. Production-function coefficients concern revenue, while second-stage coefficients concern estimated efficiency; they should not be blended. An insignificant R&D relationship in this model does not demonstrate that innovation investment lacks value.
PDF 파일 1, 2, 3, 4쪽PDF pages 1, 2, 3, 4
평균 효율성 0.702761, 시장점유율은 제한적 근거Mean efficiency of 0.702761 and modest market-share evidence
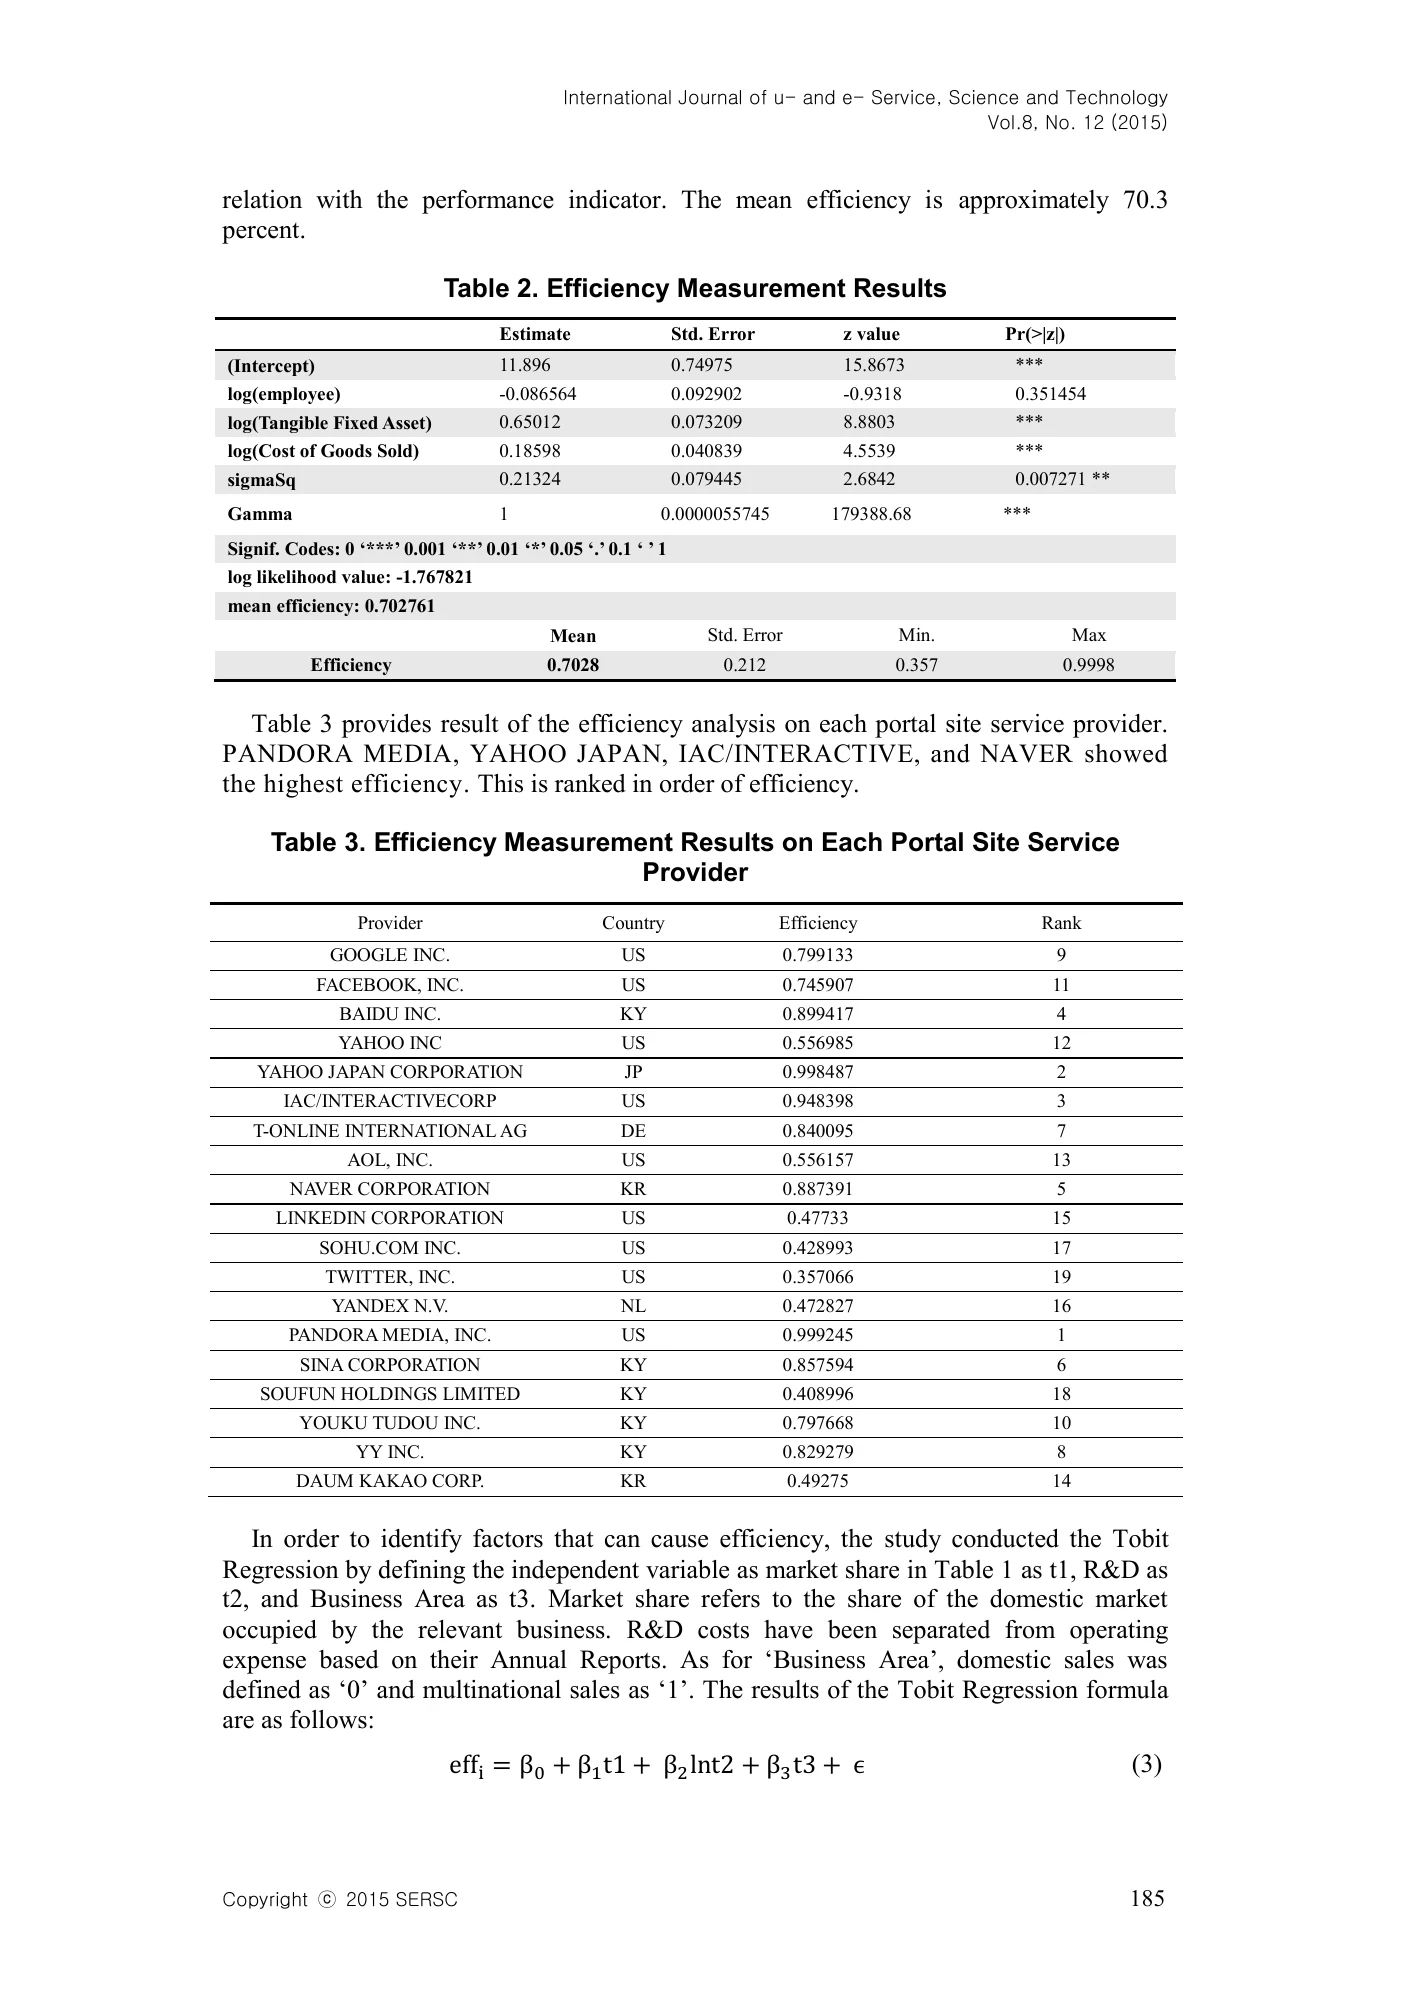
표 2의 평균 기술효율성은 0.702761입니다. 유형고정자산의 로그 계수 0.65012와 매출원가 0.18598은 유의한 양의 값이며 직원 수 −0.086564는 유의하지 않습니다. 평균 효율성을 '비용 29.7%가 낭비'라고 단순 번역할 수는 없습니다.
Table 2 reports mean technical efficiency of 0.702761. Logged tangible assets (0.65012) and cost of goods sold (0.18598) have significant positive production coefficients, while employees (−0.086564) are insignificant. The mean score should not be translated mechanically into a statement that 29.7% of costs are wasted.
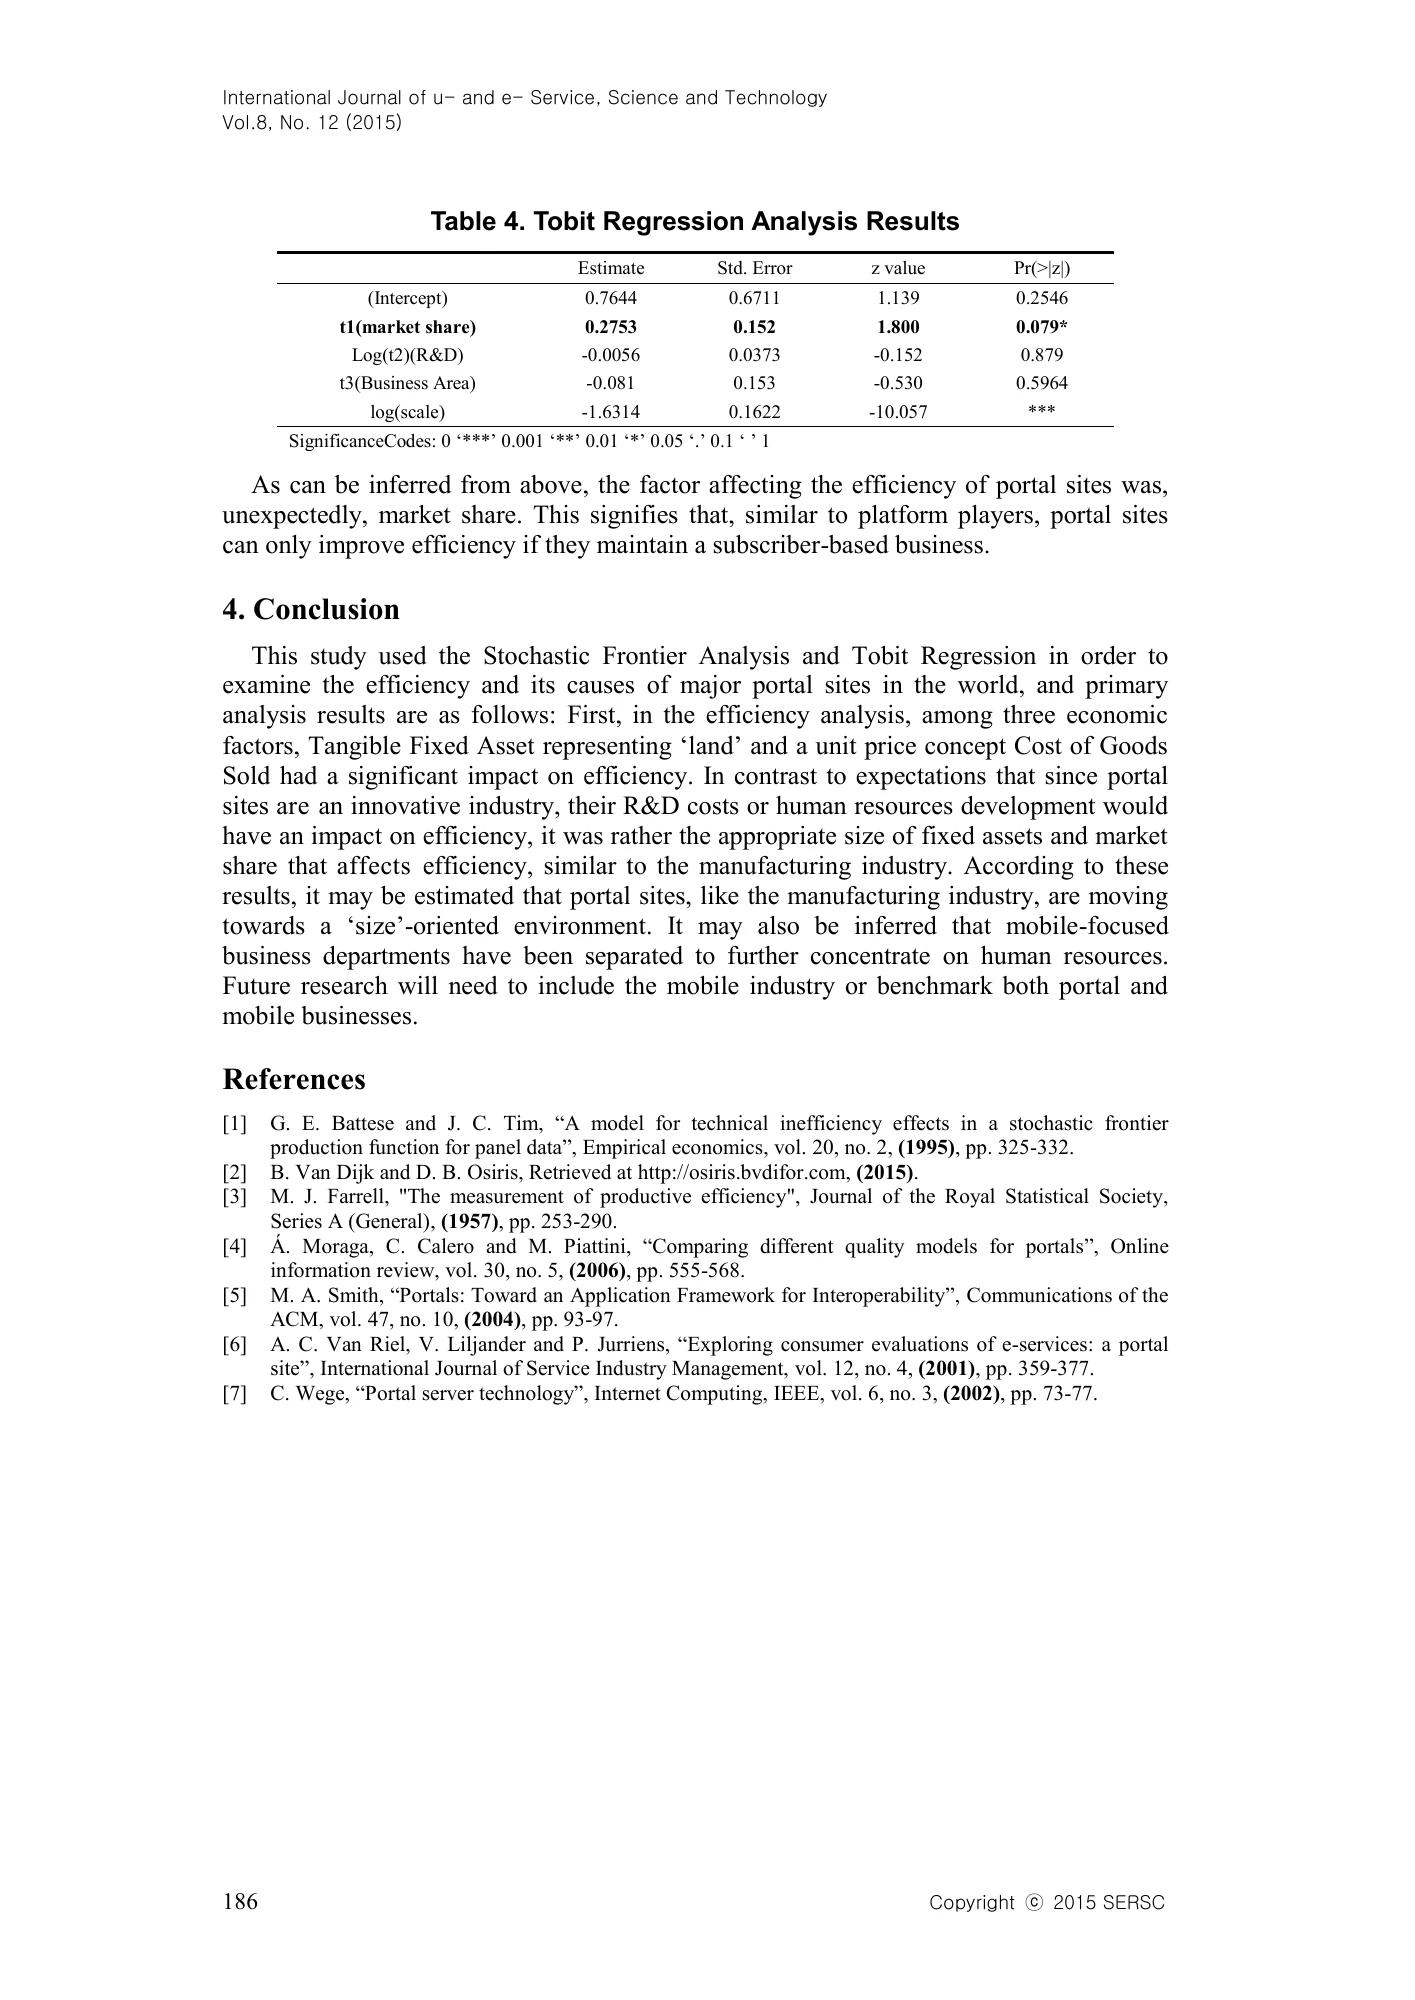
표 4에서 시장점유율 계수는 0.2753, p=0.079여서 5% 기준에서는 유의하지 않고 10% 수준의 제한적 근거입니다. R&D와 국제 사업범위도 유의하지 않습니다. 원문의 별표 표기보다 실제 p값을 함께 보여주어 시장점유율 효과를 과장하지 않습니다.
Table 4 gives a market-share coefficient of 0.2753 with p=0.079: suggestive at 10%, but not significant at 5%. R&D and international business scope are insignificant. Reporting the actual p-value alongside the printed result avoids overstating the strength of market-share evidence.
PDF 파일 3, 4쪽PDF pages 3, 4
핵심 결과를 표로 읽기Read the key results in tables
| 변수Variable | 계수Estimate | p |
|---|---|---|
| 국내 시장점유율Domestic market share | 0.2753 | 0.079 |
| R&D 로그Log R&D | −0.0056 | 0.879 |
| 다국적 사업범위Multinational business area | −0.081 | 0.5964 |
표 4. 시장점유율 p=0.079는 5% 기준 유의가 아닙니다. 표 1 단위·기초통계 충돌은 해결되지 않아 그 수치는 재사용하지 않았습니다.Table 4. Market share at p=0.079 is not significant at 5%. Unresolved units/descriptive-statistic inconsistencies in Table 1 are not reproduced.
원문 표 4 발췌Selected values from original Table 4 · PDF 파일 4쪽PDF page 4
원문의 핵심 표·그래프Key tables & figures in the source
표·그림이 수록된 원문 페이지입니다. 이미지를 누르면 확대할 수 있습니다.Original pages containing the selected tables or figures. Select an image to enlarge it.
생산함수와 상대 효율성Production function and relative efficiency
효율성과 시장 특성의 관계Efficiency and market characteristics
플랫폼 성장과 자본·비용 구조를 함께 보기Examine platform growth with capital and cost structure
디지털 사업이라도 자본과 비용 구조, 시장 기반이 생산성 설명에서 중요할 수 있다는 역사적 사례입니다. 저자는 규모 지향 환경을 논의하지만, 큰 기업이 언제나 효율적이라는 법칙이나 특정 기업의 현재 경쟁력을 확인한 결론은 아닙니다. 모바일 사업을 포함한 후속 비교도 제안합니다.
The study offers a historical example of why capital, cost structure and market position may matter in digital businesses. Its scale-oriented discussion is not a universal law that larger firms are more efficient, nor an assessment of any company’s current competitiveness. The paper proposes extending comparisons to mobile businesses.
PDF 파일 4쪽PDF page 4
이질적인 소표본과 모형 경계의 문제A heterogeneous small sample and modeling boundaries
기업 19곳과 넓은 포털 정의, 회계자료 비교 가능성, SFA의 분포 가정에 민감합니다. 표 1 일부 기초통계의 단위·최솟값 표기는 평균 등과 정합성 확인이 필요해 여기서는 재사용하지 않았습니다. 효율성 순위는 선택 변수와 표본의 결과이며 공적 가치·혁신성·사용자 만족도 전체를 뜻하지 않습니다.
Nineteen heterogeneous firms, a broad portal definition, accounting comparability and SFA assumptions limit the comparison. Some Table 1 units and minimum-value entries require consistency checks and are not reproduced here. Frontier efficiency is conditional on the variables and sample, not a complete rating of innovation, satisfaction or public value.
PDF 파일 2, 3, 4쪽PDF pages 2, 3, 4
근거 쪽: Evidence pages: 1, 2, 3, 4 · PDF 파일 기준, 인쇄 쪽수와 다를 수 있습니다. · PDF file pagination may differ from printed page numbers. 원문 출처 ↗Source ↗
원문 이미지 보기 · 1장View original document images · 1
서지 정보Bibliographic information
- 학술지Journal
- International Journal of u-and e-Service, Science and Technology
- 권(호)Volume (issue)
- 8(12)
- 쪽Pages
- 183–186
- 게재Published
- 2015
- 색인Indexing
-
- SCOPUS (저자 실적 기록 기준)(per the author's records)
인용하기Cite APA · BibTeX
APA
Kim, Y., Kim, J., Choi, J., & Kim, Y. (2015). International Comparison on Efficiency of Portal Service Providers Using Stochastic Frontier Analysis. International Journal of u-and e-Service, Science and Technology, 8(12), 183–186. https://doi.org/10.14257/ijunesst.2015.8.12.18
BibTeX
@article{kim2015-portal,
  author = {Kim, Yonghee and Kim, Jonghoon and Choi, Jeongil and Kim, YounSung},
  title = {International Comparison on Efficiency of Portal Service Providers Using Stochastic Frontier Analysis},
  journal = {International Journal of u-and e-Service, Science and Technology},
  year = {2015},
  volume = {8},
  number = {12},
  pages = {183--186},
  doi = {10.14257/ijunesst.2015.8.12.18}
}