주요 글로벌 이동통신사업자의 효율성 연구A Study on the Efficiency of Global Major Mobile Operators
원문 제목: A Study on the Efficiency of Global Major Mobile Operators
번역 제목은 이 사이트의 편집 번역입니다. 서지와 인용에는 원문 제목을 사용합니다.Translated titles are editorial translations for this site. Bibliographic records and citations retain the original title.
저자 표시: Author notes: 굵은 글씨: 김용희Bold: Yonghee Kim 교신저자Corresponding author
Software Engineering Research, Management and Applications (Studies in Computational Intelligence, vol. 789), 789, pp. 129–141
요약Summary
이동통신 사업자 96곳의 2012~2016년 재무 자료로 Malmquist 생산성 변화를 분해했다. 기술변화의 개선이 운영효율 저하와 상쇄될 수 있음을 보였으며 한국의 생산성 지수는0.999로 보고된다. 경쟁·세대 전환·인수합병은 결과를 해석하는 맥락이며 인과효과 추정은 아니다.
Malmquist indices decompose productivity change using 2012–2016 financial data for 96 operators. Technical progress can be offset by declining operating efficiency; Korea’s reported productivity index is 0.999. Competition, generation transitions and mergers provide interpretive context rather than identified causal effects.
한눈에 보기At a glance
- 자료 기간Data period
- 2012 – 2016
- 표본 크기Sample size
- N = 96
- 방법Methods
- Malmquist Productivity Index
- Efficiency Decomposition
- Cross-Country Comparison
- 키워드Keywords
- Mobile Operators
- DEA
- Telecommunications Efficiency
- OECD
- Global Comparison
- Operator Performance
- Network Economics
원문을 바탕으로 연구의 논리와 결과를 풀어쓴 해설입니다. 수치는 표시한 표와 쪽을 기준으로 읽습니다. 아래 표는 핵심 항목을 웹에서 읽도록 재구성했고, 원문 표·그림이 있는 페이지를 함께 제공합니다.This reading guide explains the paper’s reasoning and findings in new wording. Tables below re-present selected source results for web reading, alongside images of the relevant original pages.
연구 질문과 배경Question and context
이동통신 산업의 생산성 변화는 운영을 더 잘해서 나타나는가, 아니면 기술적 가능성의 경계가 바뀌어서 나타나는가. 이 연구는 글로벌 주요 사업자의 재무 자료로 국가별 생산성 변화를 비교하고 이 두 요인을 나누어 살핀다.3G에서4G로의 전환, 경쟁과 M&A는 그 결과를 해석하는 산업 맥락으로 논의된다. SERA2018 관련 연구를 수록한 Springer 단행본의 장이며, PDF 저작권·출판사 인용 기준의2019년 장으로 소개하는 것이2018년 학술행사와 출판 연도를 혼동하지 않는 방식이다.
Does mobile-sector productivity change because operators catch up in their operations, or because technological possibilities move outward? The chapter compares financial-data-based productivity across countries and separates these components. The 3G-to-4G transition, competition and mergers provide interpretive context. It is a Springer book chapter associated with SERA2018, but its printed copyright and citation year are 2019; conference timing should not replace the chapter’s publication year.
PDF 파일 1, 6, 7, 10, 11쪽PDF pages 1, 6, 7, 10, 11
자료와 변수Data and variables
OSIRIS의 통신 관련 기업 자료를 바탕으로 주요 이동통신 사업자96곳을 분석하고 일부 자료는 기업 연차보고서로 보완했다.2012~2016년 무형고정자산·감가상각·금융비용·직원 수를 투입, 매출을 산출로 사용한다. 재무금액 단위는 표1에서 천 달러로 명시한다. 초록은40개국이라고 설명하지만 표2의 국가 행 범위와는 최종 대조가 필요하므로 모든 표본이 OECD 회원국이라는 표현을 그대로 반복하지 않는다. 기업 단위 회계자료와 순수 이동통신 부문 자료의 차이도 고려한다.
The study uses OSIRIS data for 96 major operators, supplemented with annual reports. Inputs for 2012–2016 are intangible assets, depreciation, financial expenses and staff; output is revenue. Table 1 states financial amounts in thousands of dollars. The abstract’s forty-country description requires reconciliation with Table 2’s country coverage, so its blanket OECD-member wording is not repeated. Company accounts also need not isolate a firm’s mobile business.
PDF 파일 1, 6, 7, 8쪽PDF pages 1, 6, 7, 8
방법을 쉽게 읽기How the method works
Malmquist 지수는 한 시점의 효율성 순위보다 생산성이 이전 시점에 비해 어떻게 변했는지를 측정한다. 운영효율 변화는 사업자가 비교 경계에 가까워졌는지, 기술변화는 그 경계 자체가 이동했는지 나타낸다. 값1이 기준이고1보다 크면 해당 방향의 개선으로 읽는다. 이 둘을 분리하면 기술이 좋아져도 운영상 추격이 뒤처져 총생산성이 정체될 수 있음을 설명할 수 있다. 국가별 비교는 개별 사업자 지표를 집계한 결과이며 경쟁정책의 인과효과를 직접 추정하지 않는다.
The Malmquist index measures productivity change rather than a static ranking. Efficiency change concerns movement towards the frontier; technical change concerns movement of the frontier itself. One is the reference value, and a value above one indicates improvement in that component. Separating them allows technological progress and operational slippage to coexist. Country comparisons aggregate operator results; the decomposition does not directly estimate the causal effect of competition policy.
PDF 파일 6, 7, 8쪽PDF pages 6, 7, 8
주요 결과와 수치의 의미Findings and their meaning
표2에서 전체 생산성 지수는0.992, 운영효율 변화는0.929, 기술변화는1.069다. 한국은 생산성0.999, 운영효율0.908, 기술변화1.099로 보고돼 기술 진전과 운영효율 저하가 상쇄되는 모습을 보인다. 인도1.053, 프랑스1.048, 영국1.020과의 비교도 제시된다. 원문 표 제목은 누적 증가라고 쓰지만 본문은5년 평균으로 설명해 집계 의미의 주의가 필요하다. 따라서 이 숫자를 연평균 성장률이나 누적 수익률로 임의 환산하지 않고 원문의 지수값으로 제시한다.
Table 2 reports overall productivity at 0.992, efficiency change at 0.929 and technical change at 1.069. Korea is reported at 0.999, 0.908 and 1.099 respectively, illustrating offsetting components. India, France and Britain have productivity indices of 1.053, 1.048 and 1.020. The table’s accumulated-growth wording and the prose’s five-year-average description are not fully aligned, so these indices are not converted into annual growth rates or investment returns.
PDF 파일 8, 10, 11쪽PDF pages 8, 10, 11
핵심 결과를 표로 읽기Read the key results in tables
| 국가·집계Country or aggregate | Malmquist | 운영효율 변화Efficiency change | 기술변화Technical change |
|---|---|---|---|
| 인도India | 1.053 | 1.002 | 1.053 |
| 프랑스France | 1.048 | 0.995 | 1.059 |
| 영국United Kingdom | 1.020 | 0.979 | 1.052 |
| 한국South Korea | 0.999 | 0.908 | 1.099 |
| 전체Total | 0.992 | 0.929 | 1.069 |
2012~2016년 원문 표2의 지수다.1은 기준값이다. 누적/평균 표현이 원문에서 달라 연평균 증가율로 환산하지 않았다.Indices reported for 2012–2016 in Table 2, with one as the reference. The source’s accumulation/average wording is unresolved; no annual-rate conversion is made.
원문 Table 2, PDF8쪽Source Table 2, PDF p.8 · PDF 파일 7, 8쪽PDF pages 7, 8
원문의 핵심 표·그래프Key tables & figures in the source
표·그림이 수록된 원문 페이지입니다. 이미지를 누르면 확대할 수 있습니다.Original pages containing the selected tables or figures. Select an image to enlarge it.
표2 국가별 생산성 분해Table 2: country productivity decomposition
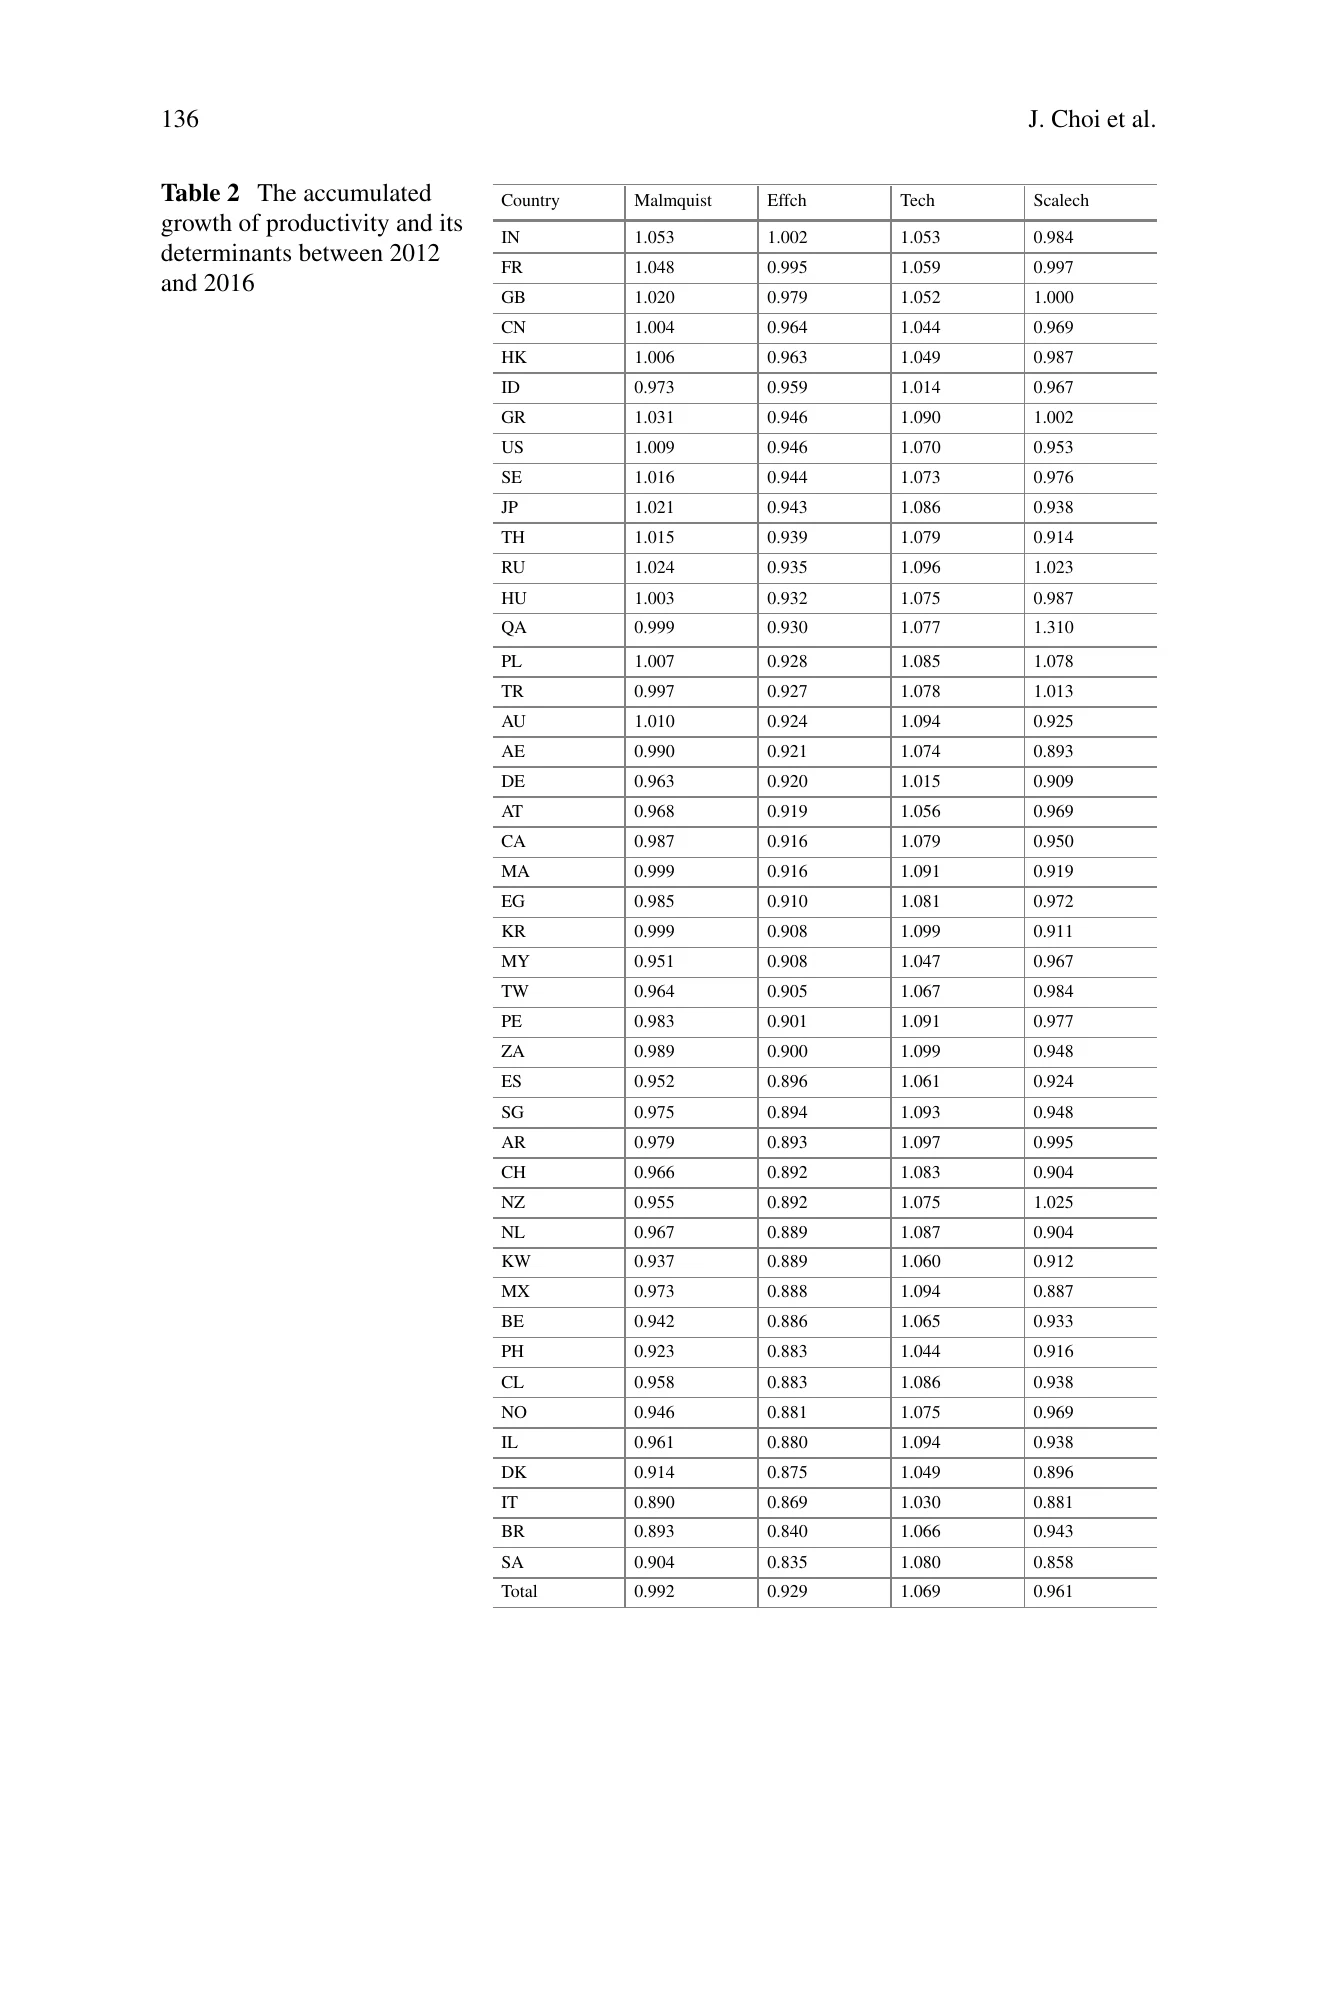
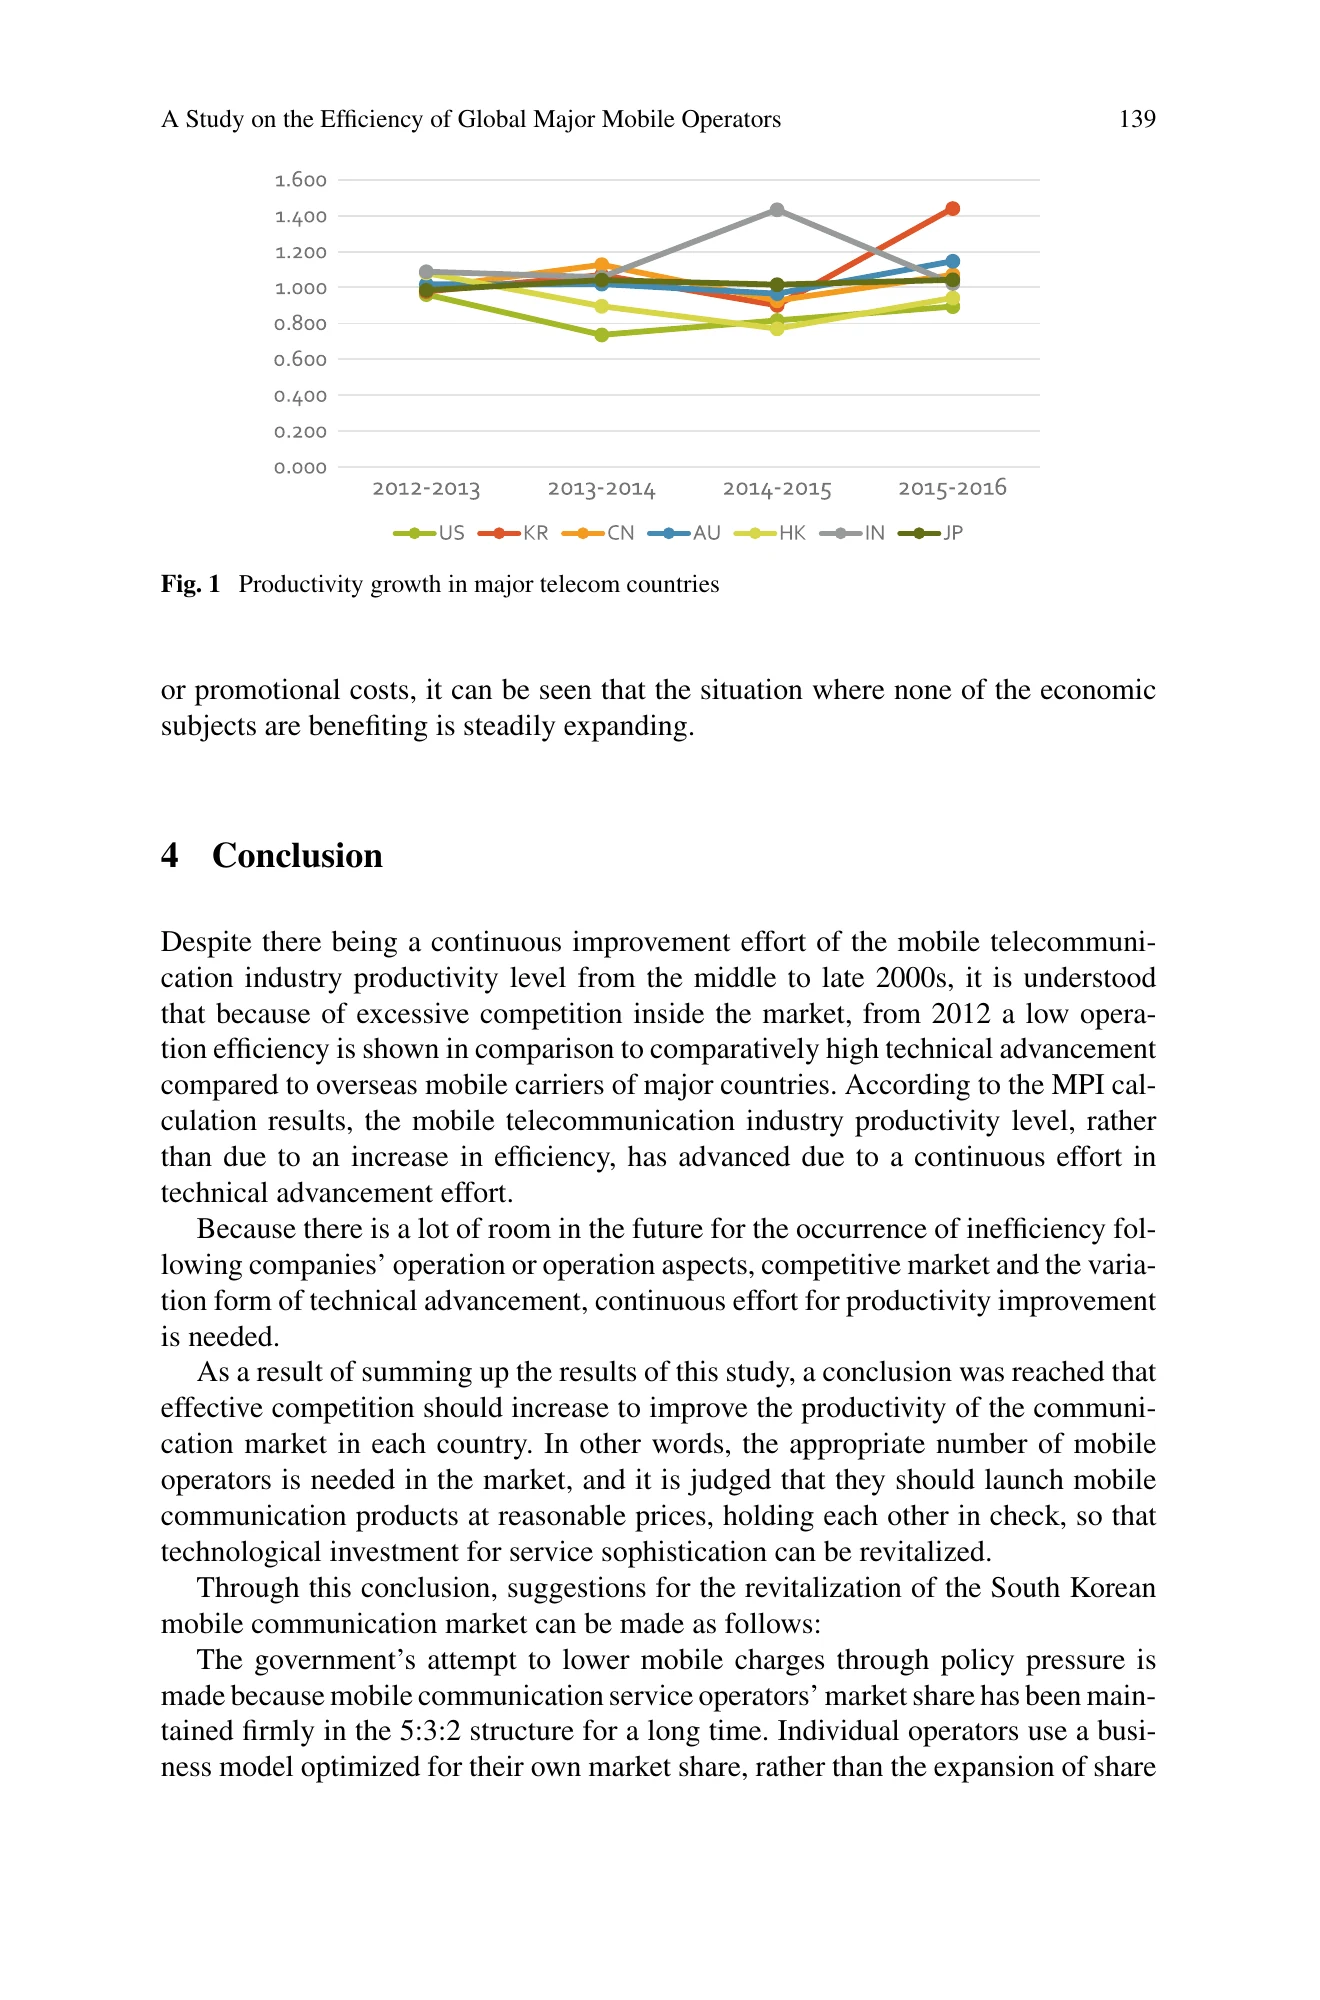
그림1 주요 통신국의 생산성 변화Figure 1: productivity growth in major telecom countries
시사점Implications
연구진은 기술투자뿐 아니라 유효경쟁과 운영상의 개선을 함께 봐야 한다고 해석한다. MVNO 도매조건, 서비스 구성의 자율성과 신규 사업자의 진입·로밍 지원 같은 정책도 당시 맥락에서 제안한다. 해설상으로는 통신 기술의 세대 전환이 빠르다는 사실과 기업의 종합 생산성이 개선된다는 사실을 구분하는 데 의미가 있다. 다만 국가 사례를 연결한 정책 설명은 추정된 인과효과와 다르므로, 사업자 수를 특정 숫자로 늘리면 같은 생산성 개선이 재현된다고 말할 수는 없다.
The authors argue for attention to effective competition and operations alongside technology investment, discussing MVNO wholesale arrangements, product autonomy, entry and roaming support. An interpretive lesson is to distinguish rapid network-generation transition from improved overall productivity. The policy narrative links country cases but does not identify a treatment effect. It cannot guarantee that moving to a specified number of operators will reproduce a particular productivity gain elsewhere.
PDF 파일 10, 11, 12, 13쪽PDF pages 10, 11, 12, 13
한계와 해석 범위Limits and interpretation
원문은 기업 수준 자료 때문에 이동통신 산업 자체를 온전히 분리해 비교하기 어렵고 후속 구조개편·생산성 연구가 필요하다고 인정한다. 투입·산출 선택에 따라 상대적 지표가 바뀌고 회계·국가 집계 조건도 결과에 영향을 줄 수 있다. 표본 국가 범위와 지수의 시간 집계 표현은 추가 확인 사항으로 남긴다. 이 해설은 표의 분해값과2019년 출판 사실을 대조한 것이며 원자료를 재추정하거나 정책 제안의 효과를 검증한 것은 아니다. 현재5G·6G 시장의 평가로 확대하지 않는다.
The source acknowledges limits of company-level accounts and calls for more sector-specific and structural-reform research. Scores depend on input–output choices and accounting and aggregation conditions. Country coverage and temporal-aggregation wording remain unresolved. This account checks reported decompositions and the 2019 chapter attribution, not the underlying estimation or the effectiveness of the recommendations. Results should not be treated as an evaluation of present 5G or future 6G markets.
PDF 파일 1, 6, 7, 8, 13쪽PDF pages 1, 6, 7, 8, 13
근거 쪽: Evidence pages: 1, 6, 7, 8, 9, 10, 11, 12, 13 · PDF 파일 기준, 인쇄 쪽수와 다를 수 있습니다. · PDF file pagination may differ from printed page numbers. 원문 출처 ↗Source ↗
원문 이미지 보기 · 1장View original document images · 1
서지 정보Bibliographic information
- 수록처Published in
- Software Engineering Research, Management and Applications (Studies in Computational Intelligence, vol. 789)
- 권Volume
- 789
- 쪽Pages
- 129–141
- 출판사Publisher
- Springer, Cham
- 게재Published
- 2019
- 인용Citations
- Google Scholar 인용 1Cited by 1 (Google Scholar) (새 창) (opens in a new tab) (2026-09-27 기준)(as of 2026-09-27)
인용하기Cite APA · BibTeX
APA
Choi, J., Park, Y., & Kim, Y. (2019). A Study on the Efficiency of Global Major Mobile Operators. In Software Engineering Research, Management and Applications (Studies in Computational Intelligence, vol. 789) (Vol. 789, pp. 129–141). Springer, Cham. https://doi.org/10.1007/978-3-319-98881-8_9
BibTeX
@incollection{choi2018-mobile,
  author = {Choi, Jeongil and Park, Youngju and Kim, Yonghee},
  title = {A Study on the Efficiency of Global Major Mobile Operators},
  booktitle = {Software Engineering Research, Management and Applications (Studies in Computational Intelligence, vol. 789)},
  year = {2019},
  volume = {789},
  pages = {129--141},
  publisher = {Springer, Cham},
  doi = {10.1007/978-3-319-98881-8_9}
}