정책·산업 자료 · 원문 해설Policy & industry material · Source-based guide
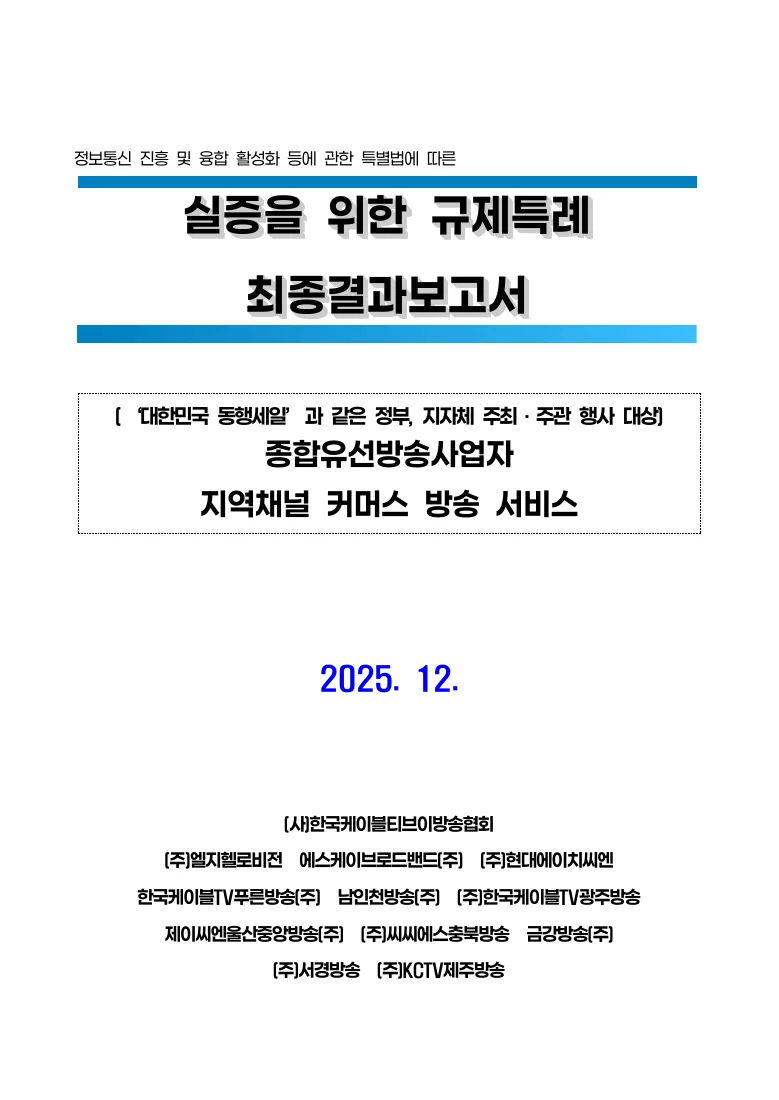
종합유선방송사업자 지역채널 커머스 방송 서비스: 실증특례 최종결과보고서Local Cable Channel Commerce: Final Regulatory Sandbox Report
원문에서 김용희의 구체적인 참여 역할은 확인 중입니다.Yonghee Kim’s specific contribution is still being checked against the source.
연구 내용Overview
지역채널 커머스방송 실증특례의 운영 현황과 판매 실적을 정리하고 경제적 파급효과 및 제도화 쟁점을 검토한 최종결과보고서다. 운영 실적과 산업연관모형의 추정효과를 구분해 읽어야 한다.
A final sandbox report documenting local-channel commerce operations and sales, alongside input-output estimates and institutionalisation issues. Observed operations and model-based economic effects must be read separately.
원보고서의 문제의식·분석·제안을 정리한 해설입니다. 수치는 표시한 표와 쪽을 기준으로 읽습니다. 아래 표는 핵심 항목을 웹에서 읽도록 재구성했고, 원문 표·그림이 있는 페이지를 함께 제공합니다.This reading guide explains the report’s questions, analyses, and proposals in new wording. Tables below re-present selected source results for web reading, alongside images of the relevant original pages.
핵심부터 읽기Start with the main findings
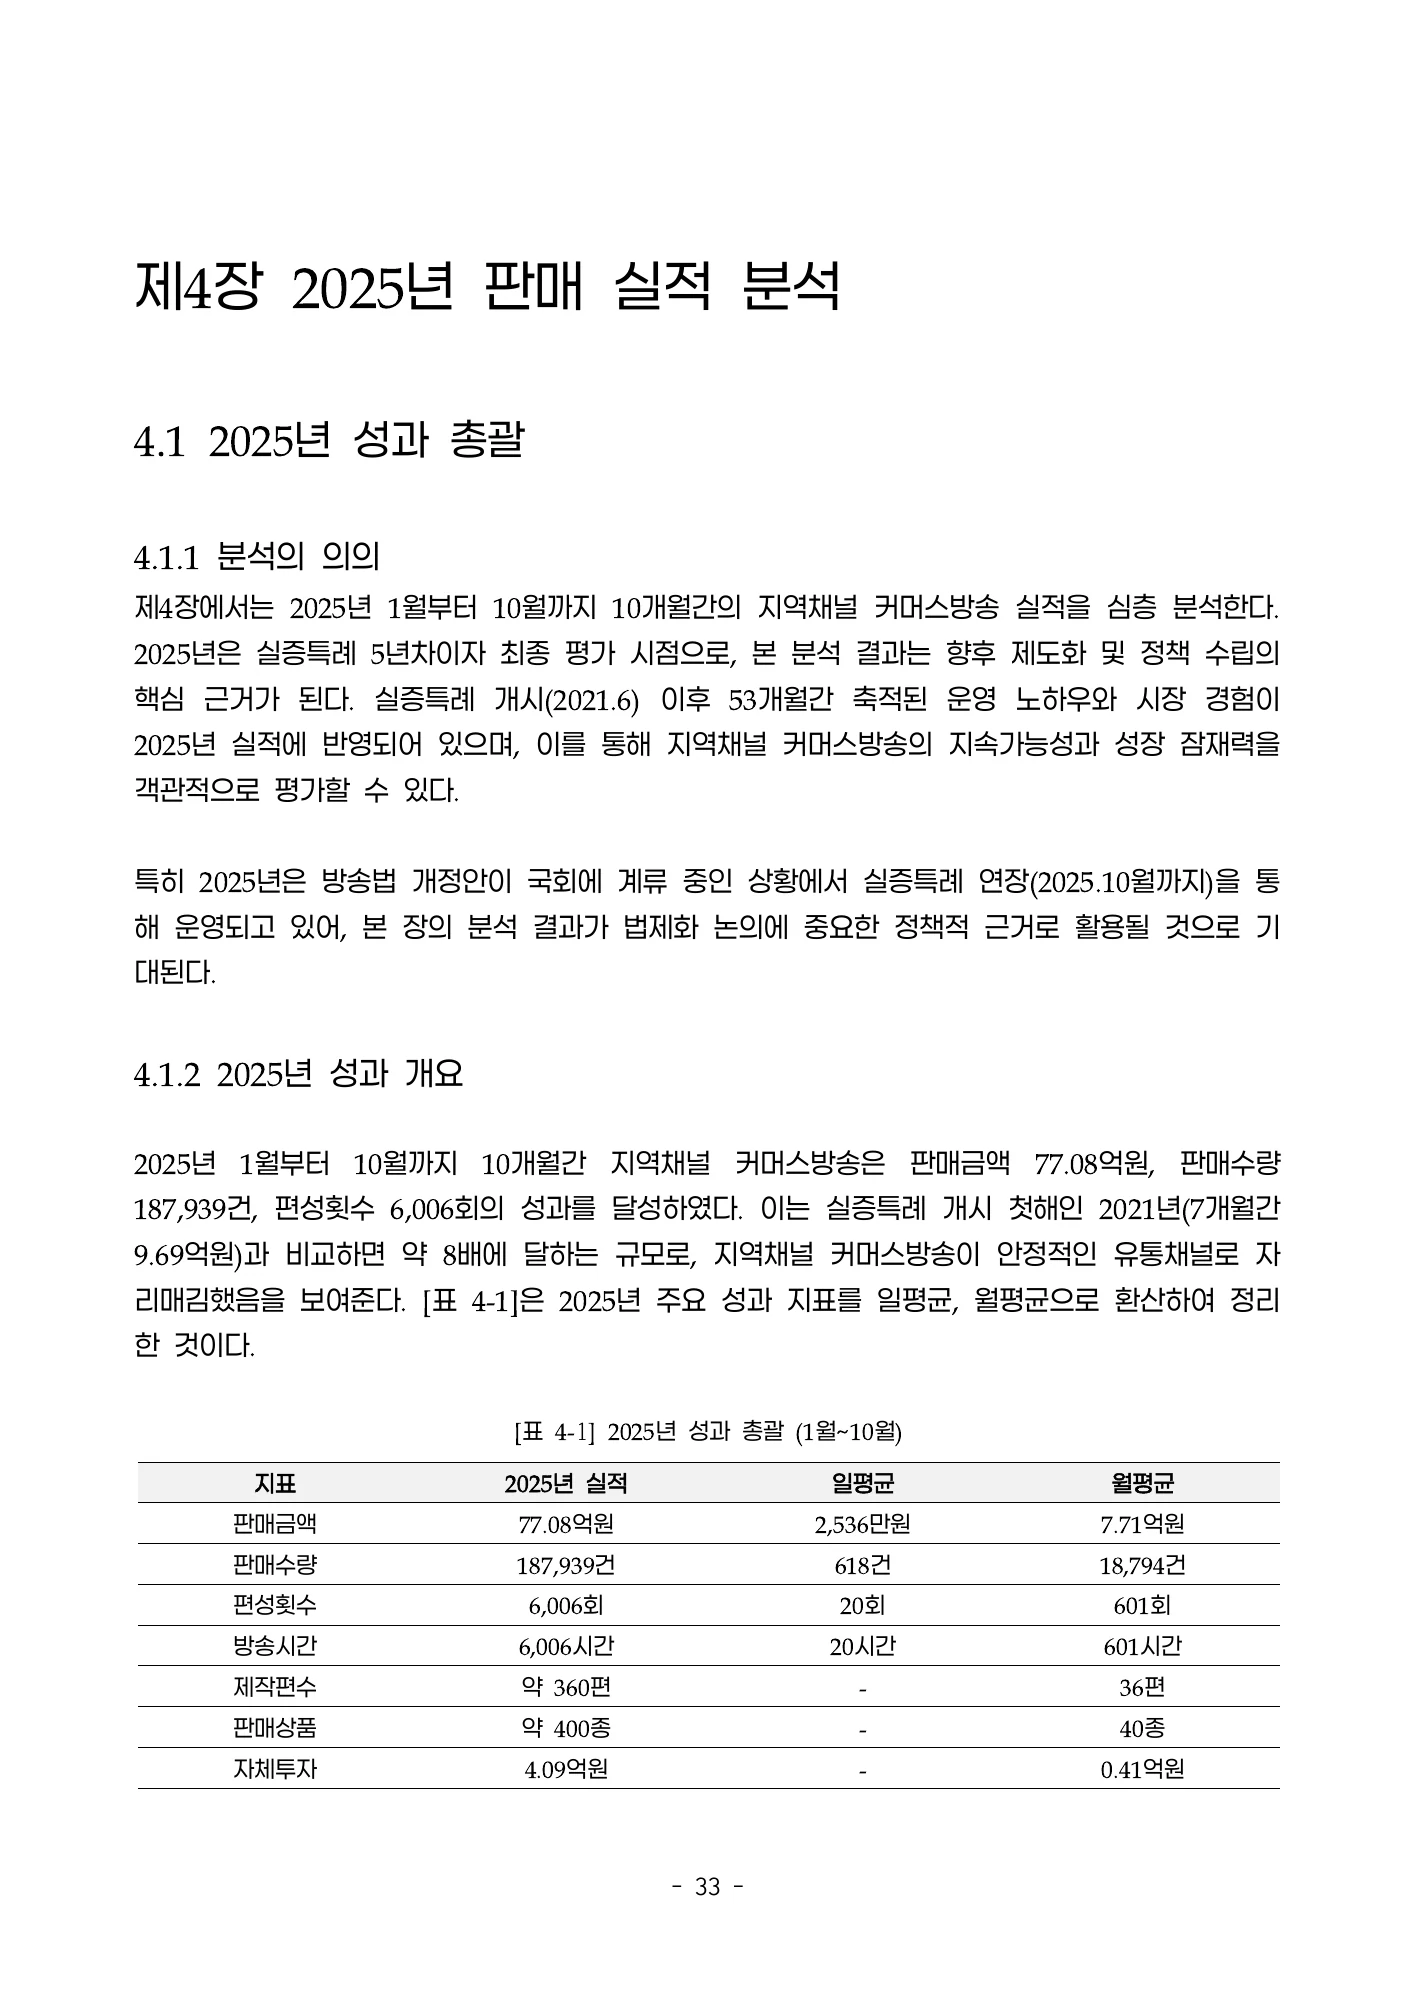
- 운영 성과의 중심은 2025년 1~10월 판매 77.08억원, 18만7,939건, 편성 6,006회입니다. 이것은 SO에 귀속되는 순이익이 아니라 상품 판매의 규모입니다. 편성 횟수와 방송시간이 모두 6,006으로 적혀 있어 이 자료의 집계상 한 편성당 1시간으로 처리되지만, 이를 모든 실제 방송의 정확한 길이로 일반화하지 않습니다.The operating totals are KRW 7.708 billion in sales, 187,939 units and 6,006 broadcasts during January–October 2025. Sales are not SO net profit. Broadcast count and hours are both printed as 6,006, implying one hour per counted broadcast in this aggregation, not proof of every transmission’s actual duration.PDF 파일 40쪽PDF page 40
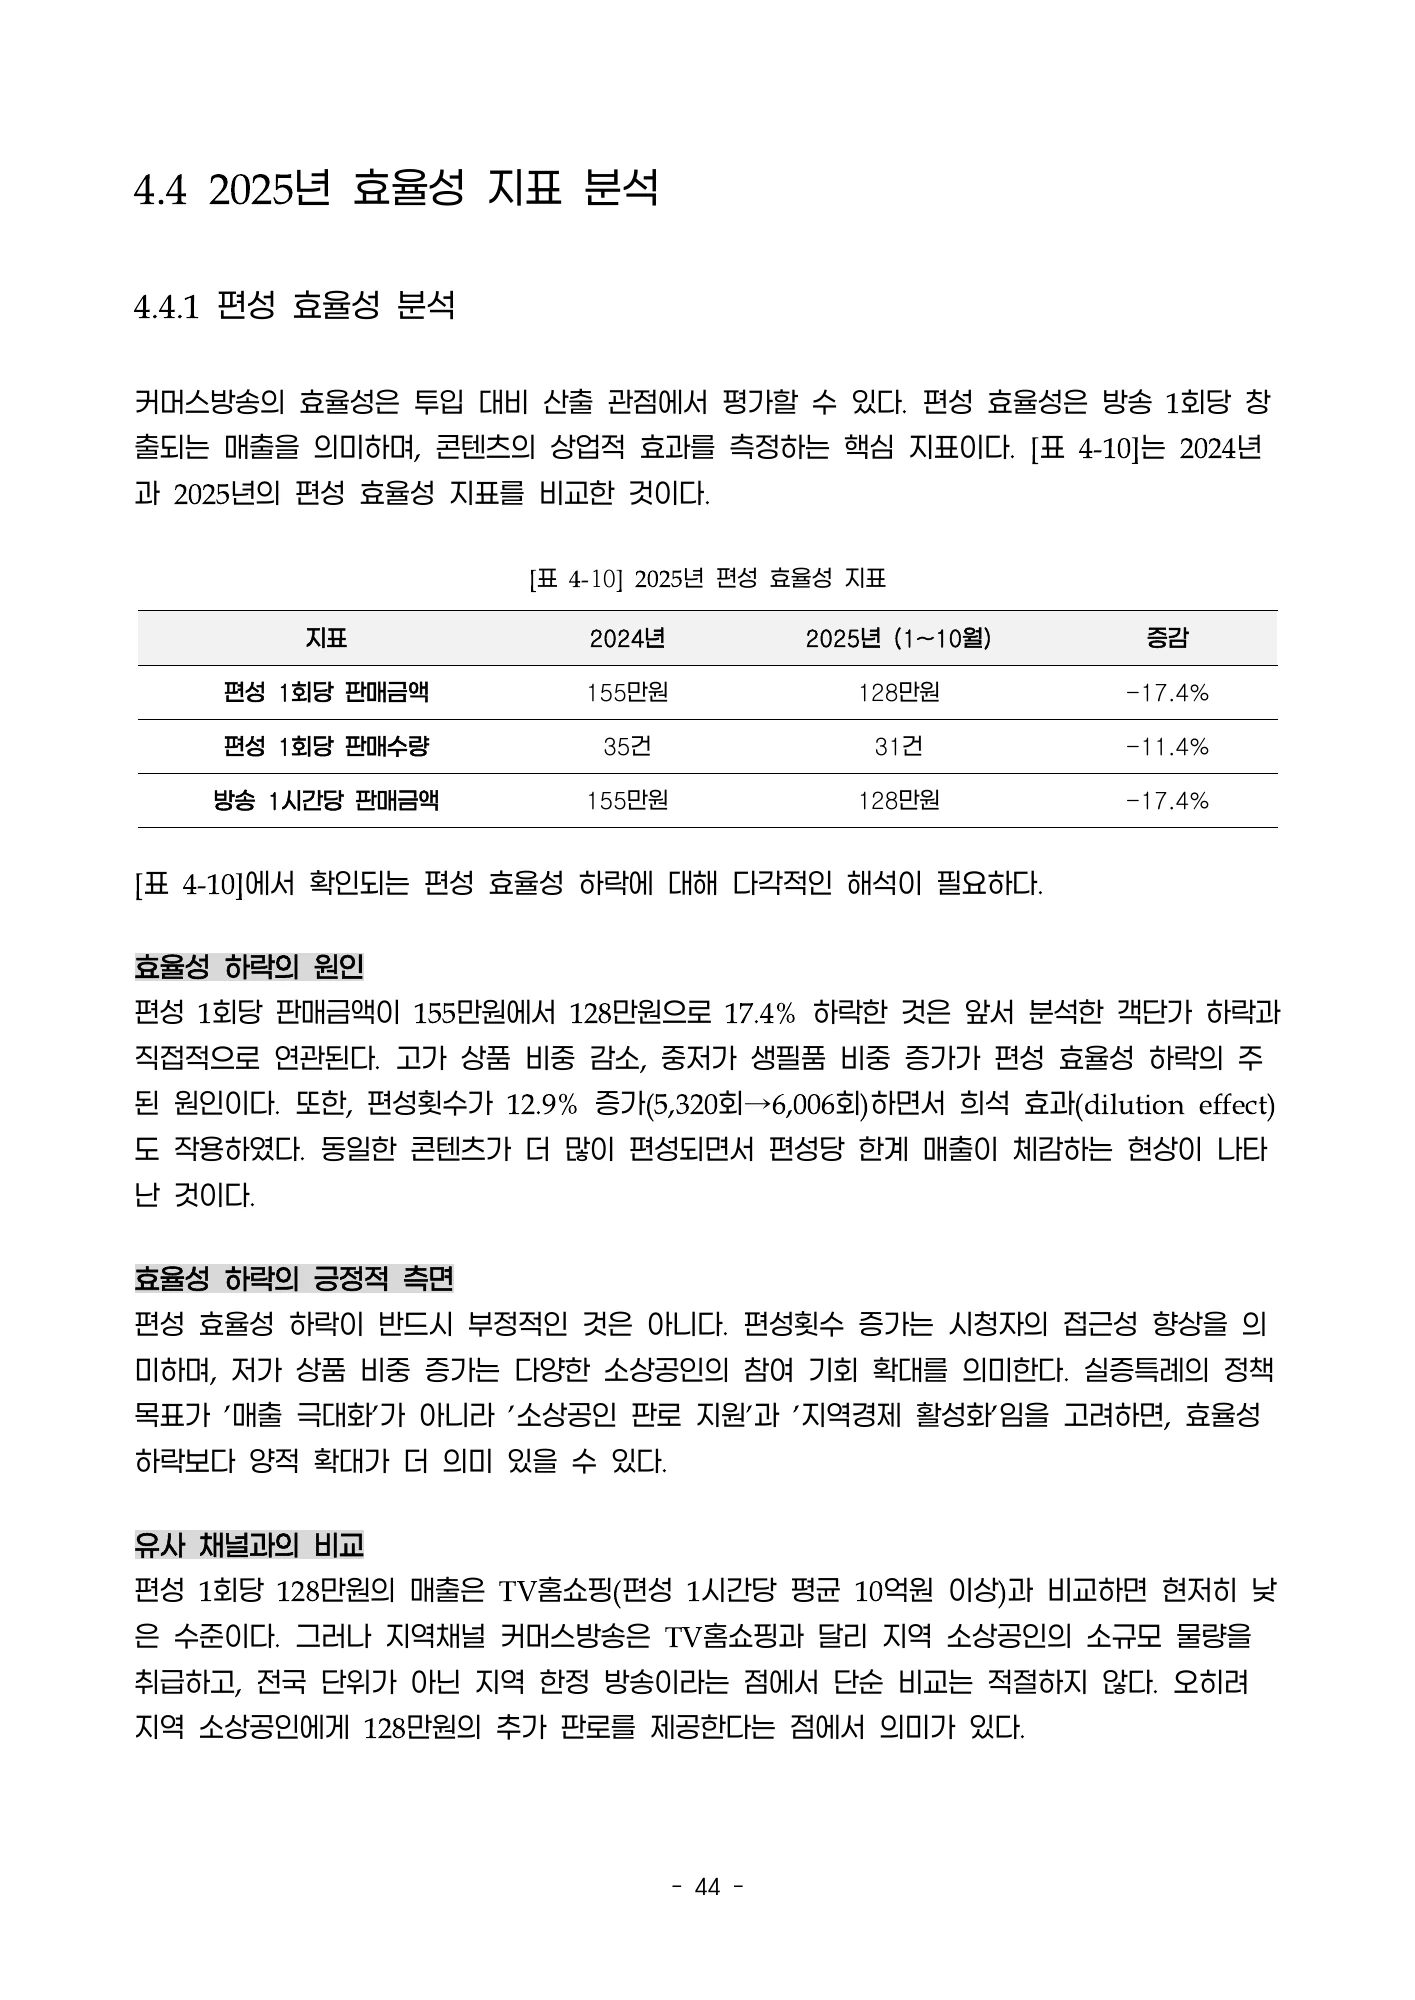
- 판매 총액만 보면 안정화로 읽힐 수 있지만 편성 1회당 매출은 2024년 155만원에서 2025년 128만원으로 낮아집니다. 방송 횟수를 늘리는 것과 회당 효율을 높이는 것은 다릅니다. 보고서는 저가 상품 구성과 반복 편성을 원인으로 설명하지만, 이 자료만으로 각 요인의 인과 기여율을 나눠 계산할 수는 없습니다.Aggregate sales and per-broadcast efficiency tell different stories. Reported sales per broadcast fall from KRW 1.55 million in 2024 to KRW 1.28 million in 2025. More transmissions do not guarantee better productivity. The source discusses lower-priced goods and repeated scheduling, but does not identify each factor’s causal contribution.PDF 파일 51, 52쪽PDF pages 51, 52
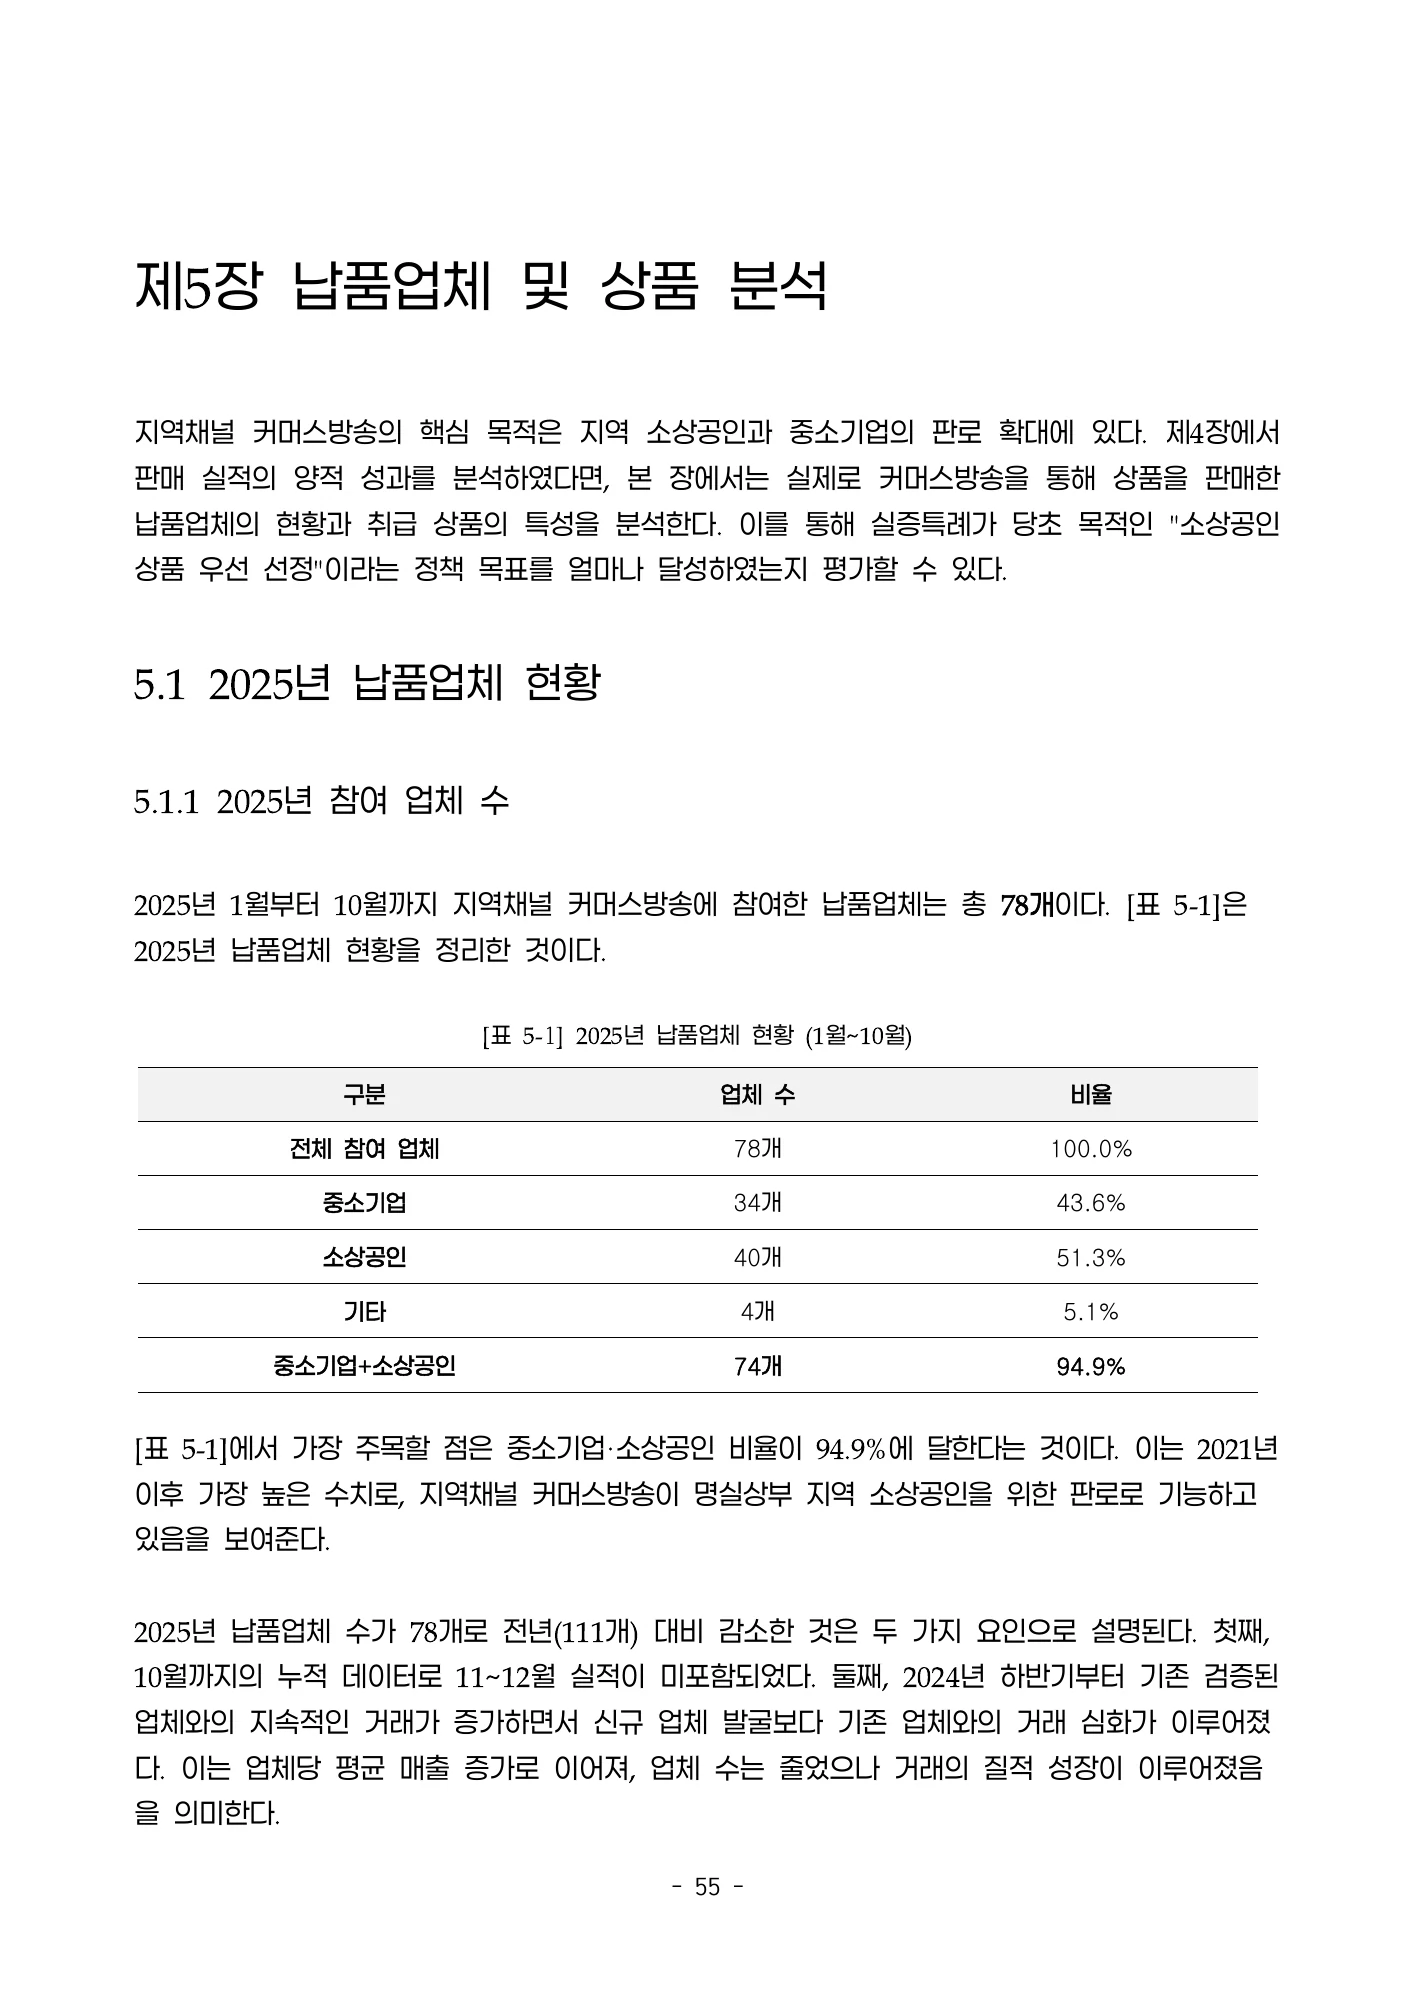
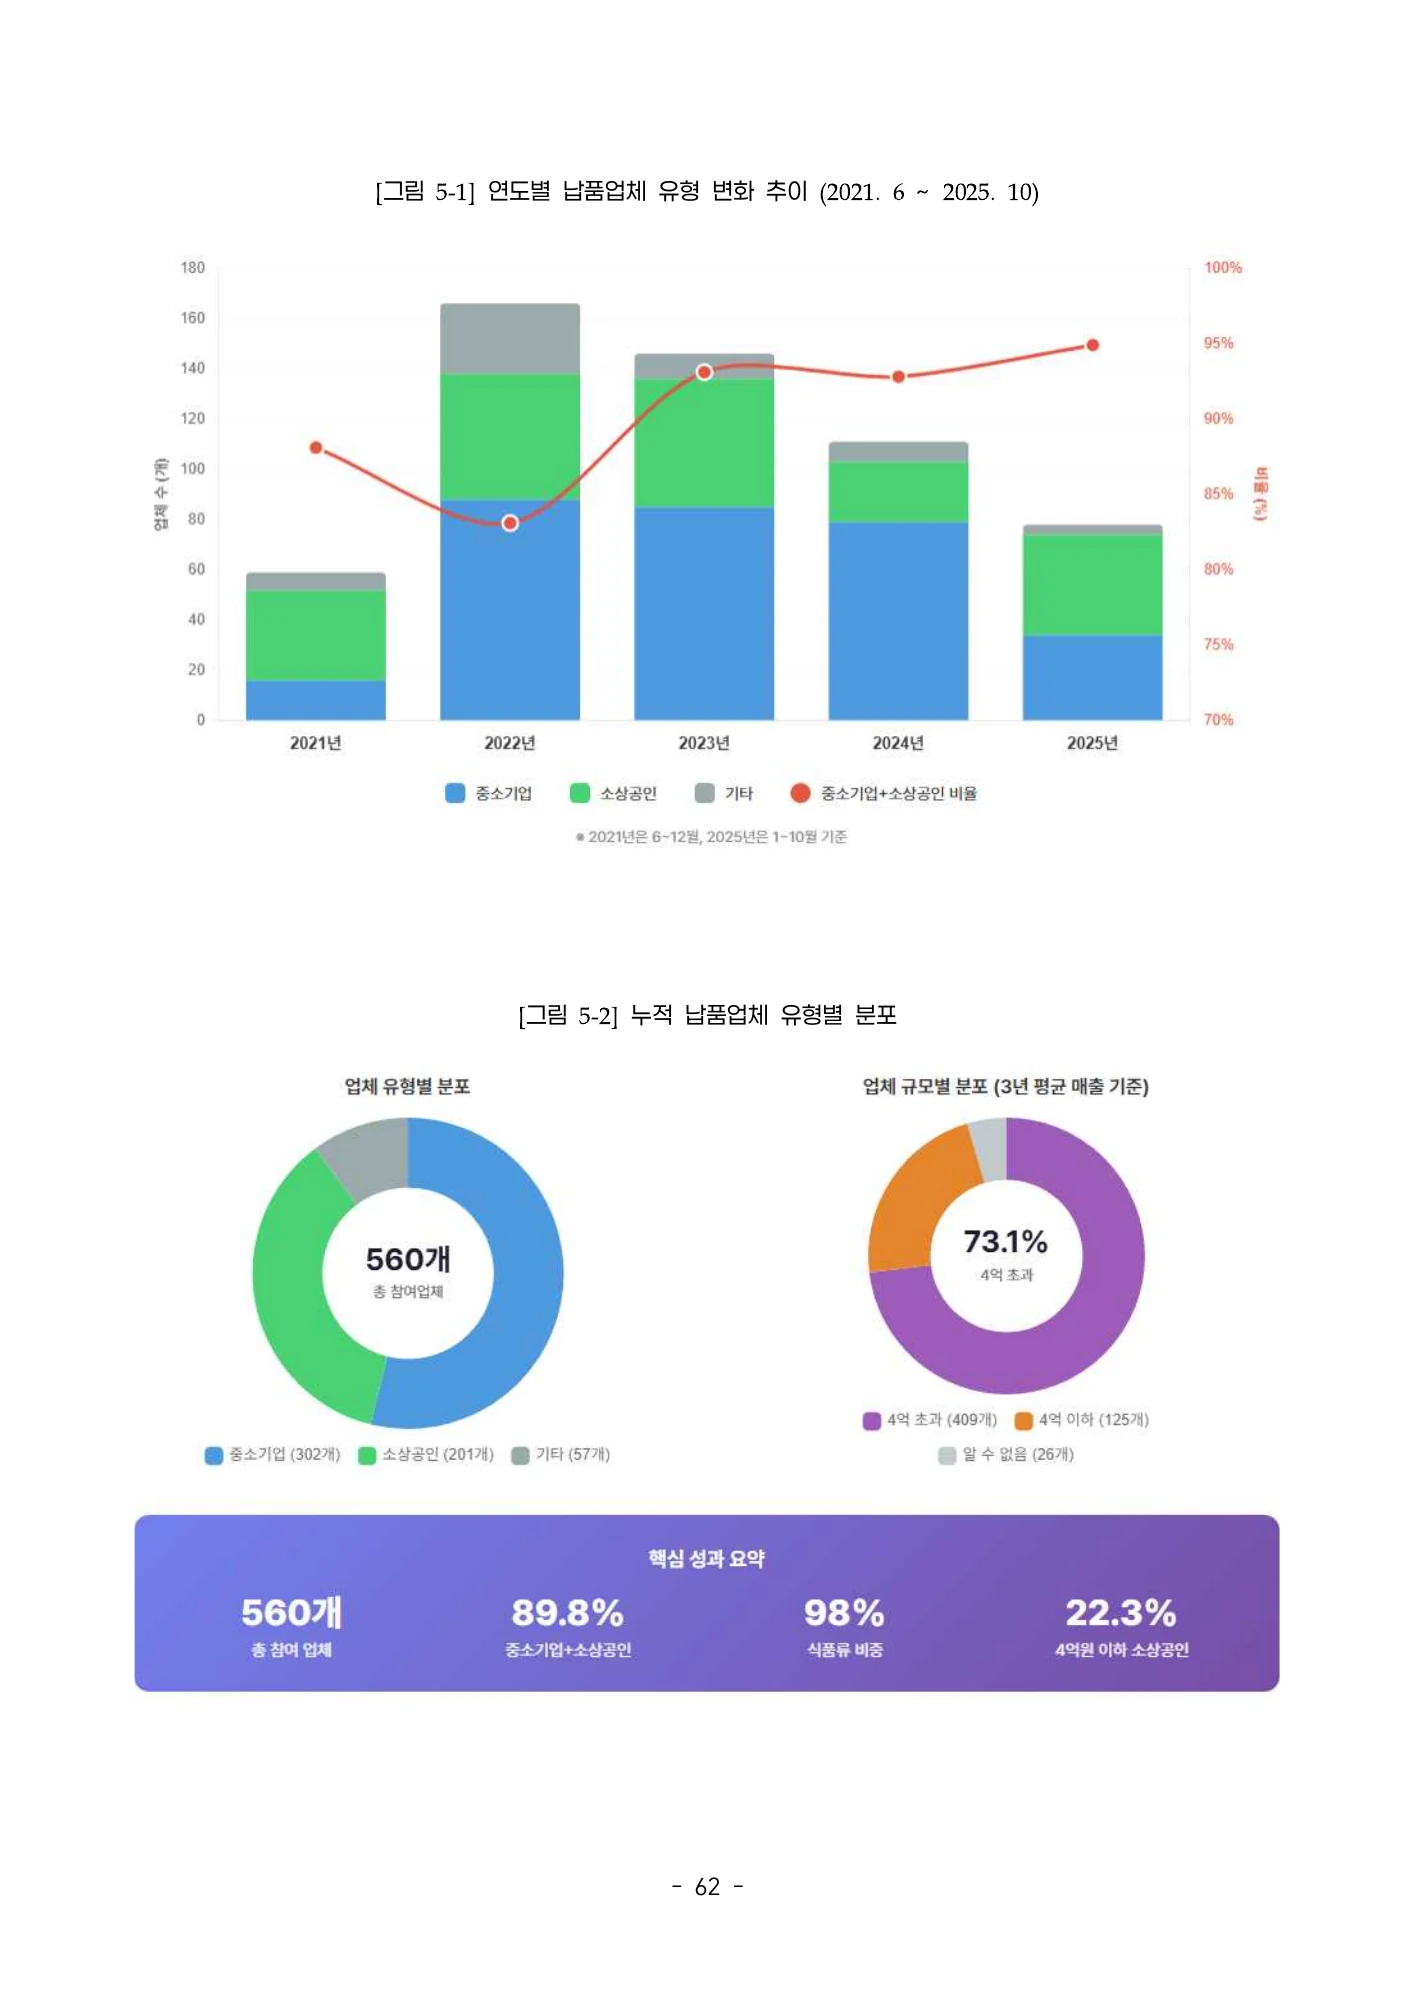
- 2025년 참여 78개 중 중소기업·소상공인은 74개, 94.9%입니다. 2021년 이후 누적 560개 중 두 유형의 89.8%와는 기간·분모가 다릅니다. 신규 판로 제공이라는 목표를 살피려면 당해 참여 업체 구성, 신규 발굴, 반복 거래, 사업자별 매출 집중을 함께 보아야 합니다.Seventy-four of 78 participating firms in 2025 are SMEs or microbusinesses, or 94.9%. The 89.8% figure for 560 cumulative firms since 2021 has a different period and denominator. Assessing new market access requires participation, recruitment, repeat trade and operator concentration together.PDF 파일 47, 62, 63, 69쪽PDF pages 47, 62, 63, 69
실증특례의 운영·성과·제도화를 함께 보기Read sandbox operations, performance and institutionalization together
이 보고서는 지역채널을 활용한 커머스 실증특례의 운영 경험과 판매 자료를 정리하고 제도화의 근거와 과제를 검토합니다. 2025년 1~10월을 중심으로 과거 누적 자료를 참고하며 운영 현황, 납품업체, 상품, 경제적 파급효과, 사회적·제도적 기여를 차례로 다룹니다. 사업이 있었다는 사실, 매출이 기록됐다는 사실, 지역에 추가 효과가 생겼다는 주장은 서로 다른 근거가 필요하므로 이 해설은 세 층을 분리합니다.
This report reviews local-channel commerce sandbox operations, sales and institutionalization. Its main window is January–October 2025, with earlier cumulative material for context. Operations, suppliers, products, modeled economic effects and policy issues are separate layers. Recorded activity, recorded sales and additional regional benefits require different evidence and are distinguished here.
PDF 파일 2, 3, 9, 89쪽PDF pages 2, 3, 9, 89
월별 운영자료와 범위의 주의점Monthly operating records and scope cautions
KCTA 서면 모니터링·월별 보고와 관계기관 제출자료를 사용하고 판매금액·수량·편성·투자·납품업체를 비교합니다. 원문은 참여 사업자를 13개라고 하면서 MSO 5개와 중소 SO 9개를 열거해 개수의 정합성 확인이 필요합니다. 이 웹 해설에서는 이를 임의로 13 또는 14개로 확정하지 않습니다. 자료의 출처와 기간은 유지하되 사업자별 집계가 중복되는지, 취소·반품이 매출에 어떻게 반영됐는지까지 독립 재감사한 것은 아닙니다.
The source uses association monitoring, monthly reports and submitted operational records. It reports 13 participating operators but lists five MSOs plus nine smaller operators, an unresolved count discrepancy. Neither count is silently adopted here. Revenue aggregation, overlap and treatment of returns have not been independently audited.
PDF 파일 9, 40, 62쪽PDF pages 9, 40, 62
규제 조건과 협력 운영의 구조Regulatory conditions and collaborative operations
제도 장은 ICT 규제샌드박스의 지정과 연장, 지역채널 커머스의 허용 내용과 법제화 논의를 다룹니다. 운영 장은 참여 사업자, 제작·편성·판매 연결과 연계 행사, 부가조건 준수를 정리합니다. 이런 설명은 제도가 작동한 절차와 보고된 준수 현황을 파악하는 데 유용하지만, 현재 허용시간과 법적 지위를 그대로 안내하는 자료는 아닙니다. 실증특례의 관측 기간과 이후 법령·사업 조건을 구분해야 합니다.
Institutional chapters explain sandbox designation, extension, permissions and legislative discussion. Operational chapters cover production-to-sales processes, events and compliance reporting. These describe procedures and reported compliance during the review period; they are not current instructions on permitted broadcasting hours or the service’s present legal status.
PDF 파일 2, 3, 6, 9쪽PDF pages 2, 3, 6, 9
2025년 10개월의 관측 실적Reported operations for ten months of 2025
성과 총괄표는 판매금액 77.08억원, 판매수량 187,939건, 편성횟수 6,006회와 자체투자 4.09억원을 보고합니다. 이 값은 보고서의 2025년 1~10월 운영 실적이며 연간 실적과 같지 않습니다. 월별·사업자별 분석과 효율성 지표도 이어지지만, 방송 편수나 매출 증가만으로 이익과 주민 후생이 늘었다고 단정할 수는 없습니다. 과거 연도와 비교할 때도 개월 수·참여 범위·실적 정의가 같은지 함께 확인해야 합니다.
The overview reports KRW 7.708 billion in sales, 187,939 units, 6,006 broadcasts and KRW 409 million in own investment. These concern ten months, not a full year. Monthly and operator comparisons add detail, but sales or broadcasts alone do not establish profit or welfare gains, and historical comparisons require aligned coverage.
PDF 파일 40쪽PDF page 40
누가 참여했는지와 상품 구성을 확인Identify participating suppliers and products
2025년 참여 납품업체는 78개로 제시되며 중소기업 34개, 소상공인 40개, 기타 4개입니다. 중소기업·소상공인 합계 74개와 비중 94.9%는 표의 합계와 일치합니다. 이는 참여 구성에 관한 지표로서 지역 전체 소상공인의 참여율이나 방송 덕분에 새로 생긴 사업체 비중은 아닙니다. 업체 수 감소에 대한 원문의 거래 심화 해석도 업체별 반복 거래와 수익 자료 없이 자동으로 질적 성장의 증거가 되지는 않습니다.
Supplier composition is 78 firms: 34 SMEs, 40 microbusinesses and four others. The combined SME/microbusiness share is 74 firms or 94.9%. This describes participating suppliers, not the proportion of all local businesses served. The report’s interpretation of deeper trading relationships needs firm-level repeat-sales and profit evidence before being generalized as quality improvement.
PDF 파일 62쪽PDF page 62
산업연관 추정은 관측 고용·부가가치가 아님Input–output estimates are not observed jobs or value added
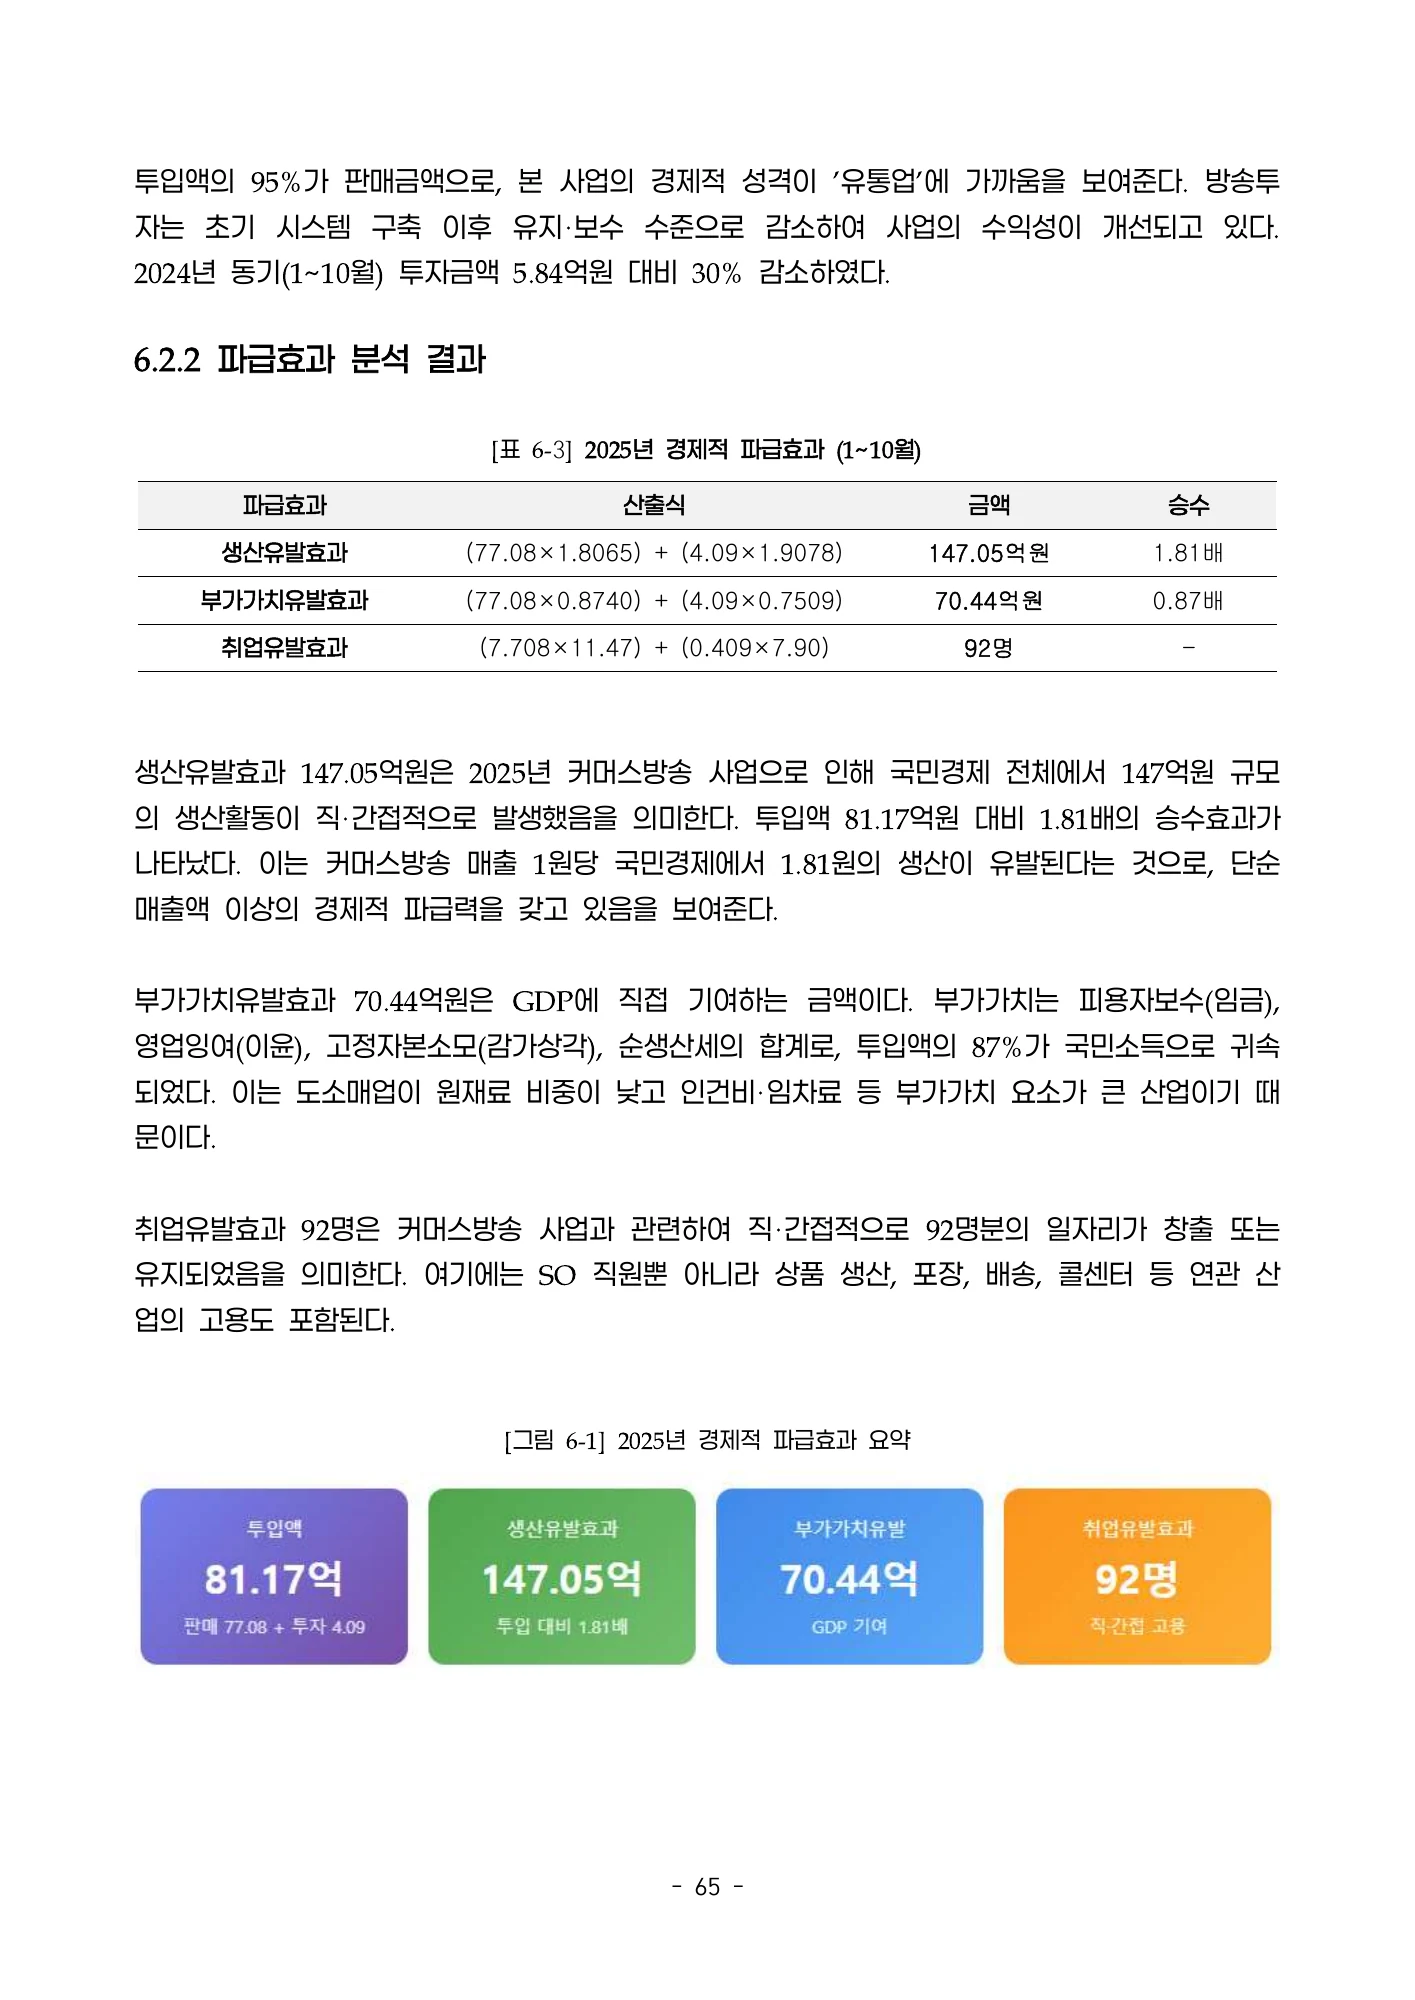
경제효과 장은 판매와 방송투자를 도소매업·방송서비스 계수에 연결합니다. 표에는 생산유발 147.05억원, 부가가치유발 70.44억원, 취업유발 92명이 보고되지만 이는 모형에 따른 유발 추정이지 새로 채용한 92명을 직접 센 결과가 아닙니다. 더욱이 방법절 p9는 2020년 지역산업연관표, 결과절 p71은 2023년 연장표를 적어 기준자료가 충돌합니다. 따라서 추정치의 출처와 정합성 검토가 필요하며 인과적 순증 효과로 소개하지 않습니다.
Sales and broadcasting investment are mapped to wholesale/retail and broadcasting input–output coefficients. Reported induced output, value added and employment are modeled estimates, not observed new hiring or net causal additions. Methods p9 cites a 2020 regional table, while results p71 cites a 2023 extended table; that vintage conflict must be reconciled.
PDF 파일 9, 71, 72쪽PDF pages 9, 71, 72
유통 기능과 공익적 기여의 평가Distribution functions and public-interest contribution
사회·제도 장은 기존 유통채널과의 차이, 지역 미디어 생태계, 협회 간 합의와 방송법 개정 논의를 다룹니다. 소상공인 접근성과 지역 콘텐츠 활용이라는 기여 가능성을 살피지만 공적 역할에 대한 서술과 검증된 사회적 효과를 구분해야 합니다. 특히 파급효과의 지역별 배분은 권역 매핑과 모형의 결과이므로 그 비율을 주민이 체감한 균형발전 성과와 동일시하지 않습니다. 서로 다른 기여 항목을 하나의 수치로 중복 합산하지 않는 것도 중요합니다.
The social and institutional chapters compare distribution channels, local-media contributions, association agreements and legislative proposals. Public-interest functions are discussed, but narrative contribution differs from demonstrated social impact. Regional allocations of modeled effects depend on mapping assumptions and should not be equated with residents’ experienced gains or added repeatedly across overlapping measures.
PDF 파일 3, 6, 89쪽PDF pages 3, 6, 89
법제화·기금·사업지원의 제안Proposals for legislation, contributions and support
결론은 상시적 법적 근거와 운영 기준, SO의 기금 부담 조정, 추가 사업지원 등으로 지속가능성을 높이자고 제안합니다. p90의 징수율과 상한 예시는 대안 설계이지 현재 확정된 납부 조건이 아닙니다. 예산 확보나 법 개정이 이미 완료되었다고 표현하지 않으며, 지원이 판매 증가로 이어질지를 사후 평가할 필요가 있습니다. 실행 시에는 판매자 선정·소비자 보호·반품 처리·회계와 공익 성과의 책임을 함께 정리해야 합니다.
The conclusion proposes permanent legal foundations, operating standards, contribution adjustments and further support. The rates and caps on p90 are design options, not confirmed current liabilities. Legislation and funding should not be described as completed. Delivery accountability should include seller selection, consumer protection, returns, accounts and public-interest performance.
PDF 파일 89, 90쪽PDF pages 89, 90
회당 효율과 판로 접근성을 함께 평가Evaluate efficiency together with access
편성 효율표의 128만원은 77.08억원을 6,006회로 나눈 값에 가까우며 판매수량도 회당 약 31건입니다. 비교 연도는 2024년 전체, 당해 실적은 2025년 10개월이라는 기간 차이가 있습니다. 명절과 행사 편성의 계절성이 있으므로 회당 평균으로 환산했더라도 연도 간 차이가 모두 생산성 변화라고 단정할 수 없습니다.
The KRW 1.28 million figure broadly matches total sales divided by 6,006 broadcasts, with about 31 units per broadcast. The comparison uses all of 2024 against ten months of 2025. Seasonal holiday and campaign scheduling means even normalised averages cannot be attributed entirely to productivity.
보고서는 회당 판매의 감소에도 낮은 가격대 상품과 소량 생산자의 노출 기회가 늘 수 있다고 해석합니다. 이는 공익 목적과 상업 효율의 서로 다른 평가 기준을 제시한 것입니다. 다만 더 많은 방송이 실제로 새로운 소상공인의 참여를 늘렸는지는 별도입니다. 당해 업체 수 78개를 전년 전체 111개와 비교할 때에도 조사기간과 신규·기존 업체를 구분해야 합니다.
The source argues that lower sales per broadcast may coexist with access for inexpensive goods and smaller producers. This distinguishes public-purpose access from commercial efficiency. Whether more broadcasts actually recruited new microbusinesses remains a separate question, requiring like-for-like periods and new-versus-returning supplier counts.
PDF 파일 51, 62쪽PDF pages 51, 62
운영실적·산업연관 계산·확대 목표를 나누기Separate operations, modelled impacts and expansion targets
경제효과 장의 147.05억원 생산유발은 판매 77.08억원과 투자 4.09억원에 산업별 계수를 적용한 모형값입니다. 같은 장 월별 판매표는 1월 5.92억원·5월 9.20억원인 반면 판매 실적 장의 월별 표는 1월 8.42억원·5월 7.71억원입니다. 총액이 같더라도 월별 자료가 일치하지 않아, 어느 달의 행사 효과가 컸는지를 두 표를 섞어 설명하지 않습니다.
The KRW 14.705 billion production-inducement figure applies sector coefficients to sales and investment. Yet the impact chapter’s monthly sales table lists January at KRW 592 million and May at 920 million, while the operating chapter lists 842 million and 771 million. Equal totals do not reconcile monthly inputs, so the tables cannot be mixed to explain individual campaign effects.
2026년 90억원 지원안은 콘텐츠 45억원, 소상공인 지원 25억원, 홈쇼핑 연계 20억원을 제안합니다. 연매출 200억원·참여 200개 업체 등은 이 확대안의 기대값이며 2025년 관측 실적이 아닙니다. 중소 SO 공동 플랫폼·교육·물류 지원도 제안하므로, 운영 실적을 제도화 필요성의 근거로 제시한 부분과 예산 확대 뒤의 효과 전망을 구분해서 읽어야 합니다.
The KRW 9 billion 2026 proposal allocates 4.5 billion to content, 2.5 billion to small-business support and 2 billion to home-shopping links. Sales of KRW 20 billion and participation by 200 firms are expectations for expansion, not observed 2025 outcomes. Shared platforms, training and logistics for smaller SOs are proposals alongside these forecasts.
PDF 파일 42, 72, 73, 91, 92쪽PDF pages 42, 72, 73, 91, 92
핵심 결과를 표로 읽기Read the key results in tables
| 지표Measure | 보고값Reported value |
|---|---|
| 판매금액Sales | 77.08억원KRW 7.708 billion |
| 판매수량Units sold | 187,939 |
| 편성횟수Broadcasts | 6,006 |
| 자체투자Own investment | 4.09억원KRW 409 million |
원문 표 4-1. 10개월 범위이며 독립 원자료 감사는 하지 않았습니다. 산업연관 추정치와 분리한 관측 운영표입니다.Original Table 4-1 covers ten months. Source records are not independently audited. These operating figures are separate from input–output estimates.
이 표를 읽는 방법How to read this table
판매금액·판매수량·편성횟수는 같은 10개월 운영 범위입니다. 자체투자 4.09억원은 상품 판매액과 구분되는 투입이며, 판매액에서 바로 빼서 사업 순이익을 구할 수 없습니다. 공급자 정산금·물류·운영비와 수수료 귀속이 함께 필요하기 때문입니다.Sales, units and broadcasts cover the same ten-month period. Own investment is a separate input and cannot simply be subtracted from merchandise sales to obtain business profit; supplier settlement, logistics, operating costs and retained fees are also needed.
월평균 7.71억원을 12개월로 늘린 약 92.5억원은 기계적인 연환산입니다. 명절·계절 편차가 있는 시장의 확정 연간 결산으로 표시하지 않습니다. 누적 53개월 값과 당해 10개월 값을 비교할 때도 사업 개시 기간의 차이를 유지합니다.About KRW 9.25 billion obtained by extending the monthly average to twelve months is mechanical annualisation, not a completed annual result in a seasonal market. The 53-month cumulative and ten-month current-period measures must retain their different exposure periods.
PDF 파일 40, 60쪽PDF pages 40, 60
원문 표 4-1 발췌Selected entries from original Table 4-1 · PDF 파일 40쪽PDF page 40
| 유형Type | 업체 수Firms | 비중Share |
|---|---|---|
| 중소기업SMEs | 34 | 43.6% |
| 소상공인Microbusinesses | 40 | 51.3% |
| 기타Other | 4 | 5.1% |
| 전체Total | 78 | 100.0% |
원문 표 5-1. 참여업체 내부 구성비이며 지역 전체 사업체의 참여율이 아닙니다. 산업연관 기준연도 충돌과는 별개의 기술통계입니다.Original Table 5-1. Shares concern participating suppliers, not all businesses in a region; these descriptive counts are separate from the input–output vintage conflict.
이 표를 읽는 방법How to read this table
34개 중소기업과 40개 소상공인을 더한 74개를 전체 78개로 나눈 것이 94.9%입니다. 지역 전체 사업체 중 94.9%가 참여했다는 뜻도, 판매액의 94.9%가 두 집단에 돌아갔다는 뜻도 아닙니다. 표가 직접 보여주는 것은 참여 업체 수의 구성입니다.The 94.9% is 74 SME/microbusiness participants divided by 78 firms. It is neither the participation rate among all regional firms nor their share of sales. The table directly establishes the composition of participating firm counts.
누적 도표의 전체 560개와 89.8%는 다른 분모입니다. 당해 78개와 단순 합산하면 기존 업체가 중복될 수 있습니다. 업체 수 감소를 곧 거래의 질적 성장으로 단정하기보다는 동일 기간의 업체당 매출과 신규 진입 기록을 추가로 확인해야 합니다.The cumulative chart’s 560 firms and 89.8% use a different denominator. Adding the current 78 could double-count returning suppliers. A decline in supplier counts does not establish improved trade quality without comparable-period sales per firm and entry records.
PDF 파일 62, 69쪽PDF pages 62, 69
원문 표 5-1 재정리Original Table 5-1 reformatted · PDF 파일 62쪽PDF page 62
핵심 수치를 그래프로 읽기Read the key numbers visually
총 78개 참여업체의 수 구성입니다. 판매금액의 구성이나 지역 전체 업체 참여율이 아닙니다.Counts among 78 participating firms, not sales shares or participation among all regional businesses.
단위: Unit: 업체firms
표 5-1의 당해 10개월 수치. 560개 누적 참여와 구분합니다.Current ten-month counts from Table 5-1, distinct from the cumulative 560 firms.
원문 수치 재구성 · PDF 62쪽Re-presented source values · PDF pages 62
원문의 핵심 표·그래프Key tables & figures in the source
표·그림이 수록된 원문 페이지입니다. 이미지를 누르면 확대할 수 있습니다.Original pages containing the selected tables or figures. Select an image to enlarge it.
운영 실적의 총괄Operating overview
방송 1회당 판매 효율의 변화Changes in sales efficiency per broadcast
납품업체의 구성Supplier composition
누적 납품업체 유형과 구성 도표Cumulative supplier types and composition
경제적 유발효과의 모형 결과Modeled induced economic effects
분모·기간·산업연관 기준의 재확인이 필요Reconcile denominators, windows and input–output sources
이 자료는 실적 정리와 모형 추정, 정책 제안을 한 문서에 담고 있습니다. 사업자 수의 13 대 5+9 충돌, 산업연관표 기준연도 차이, 10개월과 누적·연간 자료의 비교는 원자료 대조 전 확정하기 어렵습니다. 직접 판매와 유발 생산·고용도 더해 하나의 실적으로 만들지 않습니다. 연구진의 김용희 개인 역할은 미확인으로 유지하며, 웹에 제시한 운영 숫자는 원문에 위치를 확인한 값으로서 독립 재현 완료를 의미하지 않습니다.
This document combines operating records, modeled estimates and advocacy. Operator counts, input–output vintages and comparisons across ten-month, annual and cumulative windows need reconciliation. Sales and induced output/jobs should not be added into one achievement. Yonghee Kim’s role remains unconfirmed, and locating reported values is distinct from independently reproducing them.
PDF 파일 9, 40, 62, 71, 72, 89쪽PDF pages 9, 40, 62, 71, 72, 89
근거 쪽: Evidence pages: 1, 2, 3, 6, 9, 40, 42, 47, 51, 52, 60, 62, 63, 69, 71, 72, 73, 89, 90, 91, 92 · PDF 파일 기준, 인쇄 쪽수와 다를 수 있습니다. · PDF file pagination may differ from printed page numbers.
근거와 검토 범위Source and review scope
93쪽의 제공된 원문 자료를 기준으로 본문·표·선정 이미지를 확인했습니다. 해설은 연구 내용을 새 문장으로 정리했으며, 실제 원문 페이지를 함께 실었습니다. 분석 결과의 독립 재현이나 기관의 공식 입장 확인을 뜻하지 않습니다.
The text, tables and selected images were checked against the 93-page source document supplied for this site. This guide is an editorial summary accompanied by original source pages. This does not imply independent replication or institutional endorsement.
확인한 PDF 쪽: Source PDF pages: 1, 2, 3, 6, 9, 40, 42, 47, 51, 52, 60, 62, 63, 69, 71, 72, 73, 89, 90, 91, 92